FTNT trade ideas

ftnt for the futureforget when this was charted but looks like its headed twords the upside! pushing for new ath? potential

FTNT - Breakout Rising Trend Channel- FTNT has broken the floor of the rising trend channel in the medium long term, which indicates a weaker initial rising rate.
- FTNT has met the objective at 66.36 after a break of the double bottom formation.
- FTNT has support at 62.70 and resistance at 69.40.
- Overall assessed as technically positive for the medium long term.
*EP: Enter Price, SL: Support, TP: Take Profit, CL: Cut Loss, TF: Time Frame, RST: Resistance, RTS: Resistance to be Support LT TP: Long Term Target Price
*Chart Pattern:
DT - Double Top | BEARISH | RED
DB - Double Bottom | BULLISH | GREEN
HNS - Head & Shoulder | BEARISH | RED
REC - Rectangle | BLUE
iHNS - inverse head & Shoulder | BULLISH | GREEN
Verify it first and believe later.
WavePoint ❤️

FORTINET Stock Chart Fibonacci Analysis 050423Trading Idea
1) Find a FIBO slingshot
2) Check FIBO 61.80% level
3) Entry Point > 62/61.80%

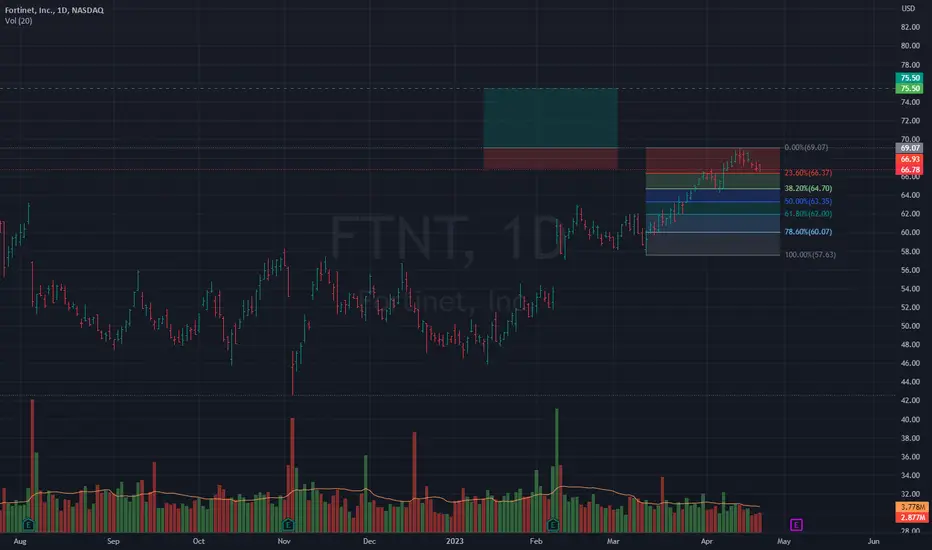
FTNT - Entry, Volume, Target, StopEnter when price clears 69.07
With daily volume greater than 4M
Target: 75.50 area
Depending on your risk tolerance: 66.93 gets you 3/1 Risk/Reward
FTNT - Breakout Ceiling Falling Trend- FTNT has broken through the ceiling of a falling trend channel in the medium long term.
- The stock has met the objective at 57 after a break of the double bottom formation.
- The price has now fallen, but the formation indicates further rise.
- The stock has support at 63 and resistance at 71.
- The RSI curve shows a rising trend, which could be an early signal of the start of a rising trend for the price as well.
- Overall assessed as technically positive for the medium long term.
*EP: Enter Price, SL: Support, TP: Take Profit, CL: Cut Loss, TF: Time Frame, RST: Resistance, RTS: Resistance to be Support LT TP: Long Term Target Price
Verify it first and believe later.
WavePoint ❤️

Buy FORTINET - high momentumStrong momentum on cybersecurity
CAGR 20% over the next 3 years on the top line
CAGR 25% over the next 3 years for the bottom line

Long FTNTFortinet's GAAP profit margins are higher than peers.
Margins remain in line with the prior year.
Fortinet reported a good quarter that saw revenue grow 29% and operating margin around 25%.

FTNT // cup handle formationAlthough there is a cup-handle formation in the graphic, the targets are determined according to Fibonacci. Let's look for at least two closures above 53.90.

short FTNTunder most MAs testing 50
big high vol reversal 6 days ago, followed by a mild bounce and faded.
bad earning drop with no reason bounce with market.
RISK:
CRWD earning today, risky

$FTNT with a Bearish outlook following its earnings #Stocks The PEAD projected a Bearish outlook for $FTNT after a Negative Under reaction following its earnings release placing the stock in drift D with an expected accuracy of 80%.

Buy off the blue line?100 SMA holding up nicely on the weekly for FTNT .
This is a big distribution pattern. It will take a while to break out , but overall trend is bullish

Bullish SharkPrice appears to have landed at the 1.113 of OX.
Possible stop under C, or the 1.113.
No recommendation.
ZS had a beat so Cybersecurity is booming today.
No recommendation
Stop below 47.30

FTNT Rolling LowerFortinet is a big player in cybersecurity with strong revenue growth and rapidly growing demand for its services. In the very Long-term, Fortinet should do well.
However, FTNT's technicals are signaling weakness on a more medium-term basis. The last year of FTNT price action has led to a rounded top formation. One could also argue that Fortinet shows signs of a head and shoulders pattern during the aforementioned period. Fortinet as of the past 7 months is now trading in a downward channel. The recent low recorded last week of 47.5 helps to confirm the continuation of bearishness in future trading. MACD on monthly/weekly/daily all are signaling further pain. The Weekly MACD is especially bearish, currently residing at its most negative level in FTNT's history.
Global market conditions are poor, and seemingly getting worse. Unfortunately, history has taught us that during periods of slowed economic activity amid monetary tightening great companies often sell off alongside their less successful peers (although not to the same degree).
To conclude: FTNT is experiencing a troubling technical outlook combined with a slowing economy/beaten-down consumer, I do not believe FTNT will be able to stay at such a high valuation with a p/e of 60, despite continued high demand. In the near term, I am looking for a move to 44.3 where the 50% fib retracement level sits. Looking further out, I expect a move down to the 30.2-27.1 range which has been an area of previous strong support as well as a 78.6% fib level. From there a rebound or consolidation period for Fortinet is likely.
As always this is not financial advice. Good luck!

Fortinet $FTNT BIG SHORT 2 This stock is played by investment bankers and trading bots! Their future outlook is based on infinite growth, but the truth is this is an extremely overpriced company and the future equity market condition isn't optimistic.
Stay away from investing in this company!
This is my personal view and not a financial advice!
NASDAQ:FTNT
NASDAQ:NDX
TVC:SPX
NASDAQ:TSLA

RectangleEarnings beat but appears folks were not happy with guidance.
Other Cyber Security stocks are also suffering today.
Horizontal/consolidation channel that is neutral until a trendline is broken. FTNT has not broken the bottom trendline today.
No recommendation.

$FTNT taking off from its launch pad!Notes:
* Strong up trend on all time frames
* Great earnings track record
* Basing for the pas ~9 months
* Moving higher from its launch pad with higher than average volume and another quarter of better than expected earnings
* It's also breaking out of an ascending triangle
Technicals:
Sector: Technology - Software - Infrastructure
Relative Strength vs. Sector: 5.72
Relative Strength vs. SP500: 54.15
U/D Ratio: 1.53
Base Depth: 51.61%
Distance from breakout buy point: -15.43%
Volume 24.53% above its 15 day avg.
Trade Idea:
* You can enter now as the price is moving higher from its launch pad with higher than average volume and on better than expected earnings
* If you're looking for a better entry you may be able to get one around the 61.9 area
* This stock usually has local tops when the price closes around 15.74% above its 50 EMA
* Consider selling into strength if the price closes 15.54% to 15.94% (or higher) above its 50 EMA
* The last closing price is 6.2% away from its 50 EMA

company has a ridiculous valuation $FTNTDon't be fooled! Future cashflows are doomed to be low. NASDAQ:FTNT

$FTNT with a Bullish outlook following its earnings #Stocks The PEAD projected a Bullish outlook for $FTNT after a Positive over reaction following its earnings release placing the stock in drift B with an expected accuracy of 75%.


RectanglePrice is still inside the rectangle top. The bottom trendline is support until broken.
Sometimes candles can tell a story and FTNT has had it's fair share of ominous candles. Most do not use candles by themselves but confirm with other indicators.
Dark Cloud Cover consists of a green candle that is followed by a red candle that towers and closes above the green candle. This was almost an engulfing candle that swallowed the green candle body but not quite. A red candle opens at the top and closes at the bottom of the candle body (excluding wicks and shadows) and vice versa for a green candle. So in the Dark Cloud Cover pattern, price opens above the green candle close and the bulls are unable to maintain the open and the red candle closes at least half way down, or more on in to prior green candle body. This shows weakness for the bulls and is often a bad sign for the bulls. I have found this candle pattern to be more reliable than most close to the top and often indicates at least a short term reversal.
Price has been unable to penetrate the level of resistance the long candle wicks created. Long wicks can point to a resistance level and long shadows can point to support.
Long candle wicks at the top get my attention if I am long. Several bad candles can tell you a lot about the psychology of the market concerning a particular security.
No recommendation.
It seems cybersecurity has held on longer than the rest of the tech sector.
This pattern is neutral for now.

