FuboTV Stock Surges After Winning Preliminary InjunctionShares of fuboTV Inc. (NYSE: NYSE:FUBO ) skyrocketed by 35.5% in the morning session following a significant legal victory against the proposed Venu Sports joint venture, involving industry giants The Walt Disney Company, FOX Corp., and Warner Bros. Discovery. This joint venture was poised to dominate 60%-80% of live broadcast sports content, which Fubo argued would stifle competition and inflate consumer prices. The court’s decision to grant a preliminary injunction has not only buoyed FuboTV’s stock but also positioned the company as a champion of consumer rights in the streaming market.
The Legal Victory: A Turning Point for FuboTV
FuboTV's victory in the courtroom is being hailed as a win for both the company and consumers. David Gandler, co-founder and CEO of Fubo, emphasized that the ruling helps ensure a competitive marketplace with multiple sports streaming options, thereby protecting consumers from potential monopolistic practices by larger players in the industry.
The injunction has had an immediate and profound impact on FuboTV's stock, which saw a massive gap up in Monday's premarket trading. The stock opened at $1.74, significantly higher than its previous close of $1.53, and continued to rise, last trading at $1.95 with a massive volume of 24,588,413 shares. This surge reflects the market’s positive reception of the ruling and the potential for a more favorable competitive environment in the sports streaming space.
Technical Analysis: Navigating the Volatility
While the legal victory has provided a significant short-term boost, FuboTV's stock remains highly volatile, which is evident in its historical price movements. Over the past year, FuboTV (NYSE: NYSE:FUBO ) has experienced 70 instances where its stock moved by more than 5% in a single session. However, a 35.5% jump is extraordinary even by Fubo’s standards, signaling that the market views this news as a major turning point.
Key Technical Indicators:
- 50-Day Moving Average: $1.30
- 200-Day Moving Average: $1.49
- Current Price: $1.91 (as of the time of writing)
- P/E Ratio: -2.19 (indicating ongoing losses)
The stock’s current price of $1.91 represents a 46.8% drop from its 52-week high of $3.56, reached in December 2023. Despite the recent surge, FuboTV’s stock is down 39.8% year-to-date, reflecting the broader challenges the company faces in turning its operations profitable.
Market Sentiment: Mixed But Improving
Despite the positive news, FuboTV remains a speculative play. The company reported 1.45 million paid subscribers in North America in its most recent quarter, up 24% year-over-year. However, it also posted a net loss of $25.8 million, underscoring the challenges it faces in achieving profitability. The market’s reaction to the injunction suggests a belief that FuboTV could leverage this legal win to improve its competitive standing, but the road to sustained profitability remains uncertain.
Institutional Activity: A Vote of Confidence?
Institutional investors have been active in FuboTV’s stock, with some increasing their stakes recently. Notably, Susquehanna Fundamental Investments LLC and Jacobs Levy Equity Management Inc. bought new positions in FuboTV during the first quarter, indicating a level of confidence in the company’s future prospects.
Conclusion: A Potential Rebound Play with Risks
FuboTV’s legal victory is a significant milestone that has reinvigorated investor interest in the stock. However, the company’s ongoing financial challenges and highly volatile stock price suggest that this is still a high-risk, high-reward investment. The stock's technical indicators show a potential for further gains, especially if the company can capitalize on the legal win to strengthen its market position. However, investors should remain cautious, as the stock’s volatility and negative earnings are key risks that could impact future performance.
FUBO trade ideas

FUBO "B" wave bottoming? First upside target 4.85USD?This is a followup idea on my previous one where we "idezied" the bottoming process, which so far has been manifested. So far I see it as a huge (A)(B)(C) forming to the upside, hence the choppiness, which overall LIKELY will stay as 3 wave structure hitting a several year upside target of between 22 - 84 USD, too soon to projectile anything more proper target. Can it be something even more bullish? Yes, but it has to proove a lot in the upcoming years. In that case it is LIKELY to be a huge overall diagonal.
What I lean towards is that we are in the huge white (A) wave, unfinished still, within that we likely to have a big ABC structure, in which the "A" wave likely completed, and we are in the "B" wave down. I have already removed the 0.382 and 0.5 fib retracement levels, generally we are reaching/has reached a very good risk/reward ratio already for the long term.
As this could be the b wave down, it is quiet tricky, morphing, wavecount changing and evolving, and likely to have more choppiness. Even it COULD undershoot as still be valid, hence I have carefully, but constantly scaling back-in for long
Next support levels to watch: 1.65-1.50
After that: 1.30-1.20 (less likely, but CAN happen)
After that: 1.16-1.05 (even less likely, but CAN happen)
Currently we are below all meaningfull moving averages (9/21/50/180&200 day MA's), but within support.
I have added a "bearish" route/count as well, for the very long term I am still bullish even in that scenario, however likely to have 1 or 2 more swingdowns deeper to complete the yellow route big wave 5, and THEN (assuming no banktrupcy) would have at least a very strong correction to the upside.

Could FUBO head to the MOON???Outlook - May load up on shares at this price. Weekly did shift lower even after 5
consecutive green days. 1.25 break and hold could spur more upside.
Upside Targets:
* 1.26--1.34--1.44
Downside Targets:
* 1.23--1.20--1.09
Daily Trend Tracker -
*DXY+ *VIX- *US10Y-

FUBO breaks out of Downtrend As you can see FUBO first broke out, then got caught in a falling wedge, which is just broke out of Friday. There's some strong resistance at 1.30, but got some room to run from there. Only reason to like this trade is because risk is low with Thursday's low being the stop.

FUBO will fly soon!FUBO- waiting for another second buying stop entry:
- Demand zone support.
- Key level support.
- Structure confirmed.

FUBO bounce in weekly demand zoneBounce in weekly demand zone. Target 4,80 in daily supply zone.
Also a reverse head&shoulder pattern forming on 4H chart
Buy!

FUBO Elliow WXY Double CorrectionFUBO started its rally from $0.96 in March 2023 and reached $3.87 in August 2023. Since August 2023, it has been declining with the Elliot WXY correction wave.
I think this correction will continue until the gap at $ 1.18 is filled. My guess is that this correction will continue until around $ 1.12-1.2. Unless it goes above $1.9, I am short FUBO.

FUBO - LONGSmall position in calls here, per last call transcript, fuboTV Inc. exceeded Q4 2023 earnings expectations with an EPS of -$0.17 against a forecast of -$0.25. The report highlighted significant year-over-year growth, including a 12% increase in paid subscribers and a 29% rise in total revenue. The company also reported a record $114 million in annual ad revenue, a 14% improvement from the previous year. Despite facing a challenging advertising market and anticompetitive practices from rivals, fuboTV is confident in achieving profitability by 2025, bolstered by a strong balance sheet, improved free cash flow, and operational efficiencies. Additionally, fuboTV filed an antitrust lawsuit against major media corporations, aiming to combat monopolistic practices in sports streaming.
fuboTV beating earnings expectations, showing significant year-over-year growth in both subscriber numbers and total revenue, alongside achieving a record in annual ad revenue. The company's strong balance sheet and improved operational efficiencies, as evidenced by better free cash flow and adjusted EBITDA, underscore its path towards profitability by 2025. These factors, combined with its proactive stance against anticompetitive practices through an antitrust lawsuit, i dont think this stock should trade in a new lower liquidity range, we are at the cheap LVN, there was also an upgrade today by a firm to 2.50, which is the next accepted trading range above if the market wants to re evaluate the fair value of FUBO.
I do not use the Wyckoff Sniper, by the way. lol. forgot to take it off as i was looking at it today out of curiosity.
I am comfortable with wyckoff logic, but this is not my go to.

FUBO turnaround could be soon?As expected after the rejection of the 200 day MA , a nice head-and shoulder formed, which has almost played out really by book. Notice the descending wedge, where the bottom should provide support (gap down possible, so the HAS could reach its target). Waiting for confirmation to close above 9day EMA, and then expecting an upward trend to fill the gap. Could hit the top of the wedge providing resistance.

FUBO TV Stock Chart Fibonacci Analysis 021124
Trading Idea
1) Find a FIBO slingshot
2) Check FIBO 61.80% level
3) Entry Point > 2.2/61.80%
Chart time frame : D
A) 15 min(1W-3M)
B) 1 hr(3M-6M)
C) 4 hr(6M-1year)
D) 1 day(1-3years)
Stock progress : B
A) Keep rising over 61.80% resistance
B) 61.80% resistance
C) Hit the bottom
D) Hit the top
Stocks rise as they rise from support and fall from resistance. Our goal is to find a low support point and enter. It can be referred to as buying at the pullback point. The pullback point can be found with a Fibonacci extension of 61.80%. This is a step to find entry level. 1) Find a triangle (Fibonacci Speed Fan Line) that connects the high (resistance) and low (support) points of the stock in progress, where it is continuously expressed as a Slingshot, 2) and create a Fibonacci extension level for the first rising wave from the start point of slingshot pattern.
When the current price goes over 61.80% level , that can be a good entry point, especially if the SMA 100 and 200 curves are gathered together at 61.80%, it is a very good entry point.
As a great help, tradingview provide these Fibonacci speed fan lines and extension levels with ease. So if you use the Fibonacci fan line, the extension level, and the SMA 100/200 curve well, you can find an entry point for the stock market. At least you have to enter at this low point to avoid trading failure, and if you are skilled at entering this low point, with fibonacci6180 technique, your reading skill to chart will be greatly improved.
If you want to do day trading, please set the time frame to 5 minutes or 15 minutes, and you will see many of the low point of rising stocks.
If want to prefer long term range trading, you can set the time frame to 1 hr or 1 day.

$Fubo Cup and Handle on WeeklyFubo Cup and Handle on weekly chart.
- High area of confluence (Trend Line , 30 SMA)
- Low volume pullback

$FUBO - Can it breakout?NYSE:FUBO The stock is trading inside a triangle and is wedged between POC resistance and trendline resistance. If it can break out of the triangle it can see further upside.
Upside targets:
$5
$6
Downside risk:
$2.42

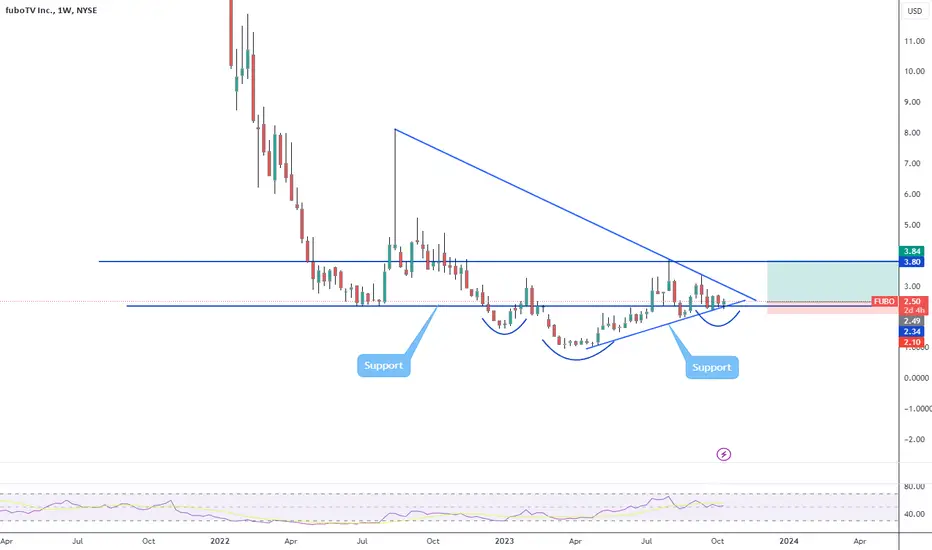
$FUBO: Relentless at 2.5FUBO has seen some consolidation around the key 2.5 area, we'll see if the Russell 2000 will give us enough room to make it to the upside. Yields also coming back down and if that continues we should see FUBO higher...good luck traders!

$FUBO - the setup looks good to meNYSE:FUBO I like the FUBO setup going into earnings tomorrow.
It's starting to breakout of a symmetrical triangle and I like how MACD and RSI is curling up.
I am betting that it could breakout to $3.50 after ER.
Downside risk is $2.0.
Don't take my word for it though.

Good entry pointPrice is forming a triangle and inverse HS and is trading just over a strong support zone. It's a good entry point bc risk and reward is great. Low risk for a big gain. My SL triggers if a weekly candle closes below the support, I do it this way bc is a very volatile stock.
FUBO LONGIHS setup here, trigger on closes over $3.18 to target 4.50-5.70
Sweeps of JAN 17 2025 FUBO $4.50C today

Fubo MASSIVE reverse head and shoulder?Investing and entering positions at the right price is always a very tricky game. But when you look into risk vs rewards and the time to start seeing the rewards.. This is the opportunity of a life time.
I love the underdog game and the manipulation of institutions to shake investors. I saw it very well in the beginning of AMD from 3 USD to 15USD and PLUG from 1 to 6USD. I took a break for several years until 2 weeks ago as Fubo is the exact business I want to invest because.
Fubo is at exact same position but in an even better position to start position and trading. There are several patterns that can take place now. First, we notice a run up before Q2 earnings, bears try to hold it. This tells us, every earning we will start see a run-up from now on most likely.
Now the question is when the Q3 run up will start and if it will be consistent growth or a week head of time.. I intend to choose in consistent growth which will start soon.
Why? Because it looks like an obvious pattern that they want it to be completed. If you look on the Q2 jumping pre-earning 18% and like 30% in week head, it broke the steady pattern Fubo intends to do. (Call them God or price manipulators) they want this to go a certain way and if you see with the massive candle jump on earning call it immediately came back to start the right reveres shoulder after completing the head.
I post this because it is potentially in the next week or two going to consolidate and start the last part of this massive 10 month pattern plus a V shape recovery could play along in the run-up to finish the pattern. I started opening a lot of positions and I'm holding them for the long long long long long term
Don't forget the Olympic games coming up next year, they will start showing profits very soon while increasing their revenue at least in 20%-50% in 2024-2025. The market cap now is 600 million..low debt..steady growth yoy. it will go higher 5 or 10 times more as soon as they show little profit. Plenty of shorts are also a big indicator for me for manipulation of institutions to grab very cheap positions. As more shorts will increase I will be more confident this thing going higher at some point. Just need to wait.
We will see how it plays until November
Good luck


FUBO: It's not time for big moves yetA good consolidation is needed to start a new cycle of growth. The longer the accumulation cycle lasts, the more serious the momentum will be. At the lower border of the consolidation channel, you can gain positions in the long term or for speculative purposes.
Good luck to all. If you liked it - subscribe.

FUBO fuboTV Options Ahead of EarningsIf you haven`t bought FUBO here:
Then analyzing the options chain and the chart patterns of FUBO fuboTV prior to the earnings report this week,
I would consider purchasing the $2.50 strike price Calls with
an expiration date of 2023-11-17,
for a premium of approximately $0.81.
If these options prove to be profitable prior to the earnings release, I would sell at least half of them.
Looking forward to read your opinion about it.

FUBOTV moves before earnings LONGWith upcoming earnings on August 4th, as shown on the @H chart, FUBO is moving.
The set of three EMAs (35/70/280) show an impending crossover the longest EMA
and a golden cross between the other two has already occurred. The MACD demonstrates
the bullish momentum. The dual time frame RSI has the low/green line crossing the 50
level from well below it and then the high/ black line in the 60 range another confirmation
of bullish trend strength. I can appreciate that other traders are anticipating a bit of
a jump in the event of an earnings beat. I will join that group. The target is the level of
the double top of mid-July. The stop loss is the level of the golden cross of the EMAs.
An identified options trade is the strike of $ 3 expiring 8/11.

$FUBO Post Inflation ReboundWhen it comes to digitally streaming sports one company stands apart from the rest. fuboTV Inc. (NYSE: FUBO) offers a wide range of content that is meticulously selected to target key demographics. It is due to this wide range of selective content that FUBO experienced a $82 million increase in revenue, which caused FUBO stock to run 150%. These gains may very well be just the beginning of FUBO’s rebound this year due to its dominance in sports streaming. That said, taking cord cutting statistics into consideration, FUBO stock could be considered a worthy long-term investment.
FUBO Fundamentals
The secret behind FUBO’s dominance in the sports media is demographic understanding. Every decision that is made by FUBO is meticulously researched, and as a result, it is able to make decisions that target key demographics. A prime example of this is their ability to target a multitude of channels in order to provide better major league coverage than any other online platform in the US. Additionally, no other streaming platform in the US offers a wider assortment of sports media. Taking these facts into consideration, it would not at all be surprising if FUBO stock continued its upward trend over the coming months.
One of the most significant upcoming catalysts for FUBO stock is the start of the NFL season in September which could cause subscriptions to increase markedly since it is the most watched sport in the US with 74.5% of Americans following it.
Pricing Power
FUBO’s clear dominance over other sports streaming platforms means that it can set its price higher than others due to the quality of its service. Earlier this year, FUBO raised its subscription by $5 on all plans yet it still has more than 1 million subscribers since there is no other platform available in the market that offers the same number of sporting events that FUBO offers.
Guidance & Cord Cutting
According to FUBO’s guidance for 2023, the company expects its subscribers to increase from 1.55 million to 1.57 million which represents an 8% YoY growth and an increase of full-year revenue from $1.235 billion to $1.265 billion. Having said that, there is a good chance that FUBO may surpass its guidance due to Cord cutting statistics and the improving economic situation in the US.
Due to digitalization, more people are moving away from traditional cable TV and acquiring digital subscriptions instead. Currently, around 35.9% of adults in the US are cord-cutters, however, that figure is projected to increase to 41.6% by 2024. Additionally, it is estimated that over 80 million US households in the US will not have any TV subscriptions in the US due to cord-cutting by 2026.
Improving Economic Conditions
Currently, inflation in the US is continuing to wane and real earnings increased in May by 0.2% according to the Bureau of Labor and Statistics. This marks the first time real earnings were positive since March 2021, which is extremely significant since real earnings represent wages after taking into account inflation. A positive number represents improved quality of life due to increased buying power.
Improved Buying Power
This increased buying power means that people have more money to utilize on commodities such as subscriptions. Taking into account the fact that FUBO is a dominant force in sports streaming, this may cause FUBO’s subscriptions to increase due to improved affordability.
FUBO Financials
According to its Q1 fiscal report, FUBO’s assets increased QoQ from $1.27 billion to $1.29 billion due to its cash balance increasing from $337 million to $358 million. On the other hand, total liabilities decreased from $874 million to $860 million, due to current liabilities decreasing from $438 million to $423 million. Taking into account FUBO’s current assets which account for $459.8 million its current ratio is 1.08, which is not ideal, but is not a negative indicator since it is still above one.
In terms of revenues, FUBO experienced a significant YoY increase from $219.1 million to $300.8 million which could be attributed to the company increasing its subscription prices. However, expenses increased YoY from $365.2 million to $405.8 million due to the increase in subscription related expenses which currently account for $301.3 million. That said, its net loss decreased from $140.8 million to $83.6 million due to its increasing revenues which may increase even further in the third and fourth quarters as a result of increasing subscriptions due to the beginning of the NFL season.
Technical Analysis
FUBO stock is in a neutral trend and is trading in a sideways channel between $2.28, and $3.08. Looking at the indicators the stock is currently above the 200, 50, and 21 MAs which is a bullish indication. Meanwhile, the RSI is approaching overbought at 65 and the MACD is curling approaching a bearish crossover.
As for the fundamentals, the upcoming NFL season is a catalyst to watch as FUBO could increase its subscribers in Q3 and Q4 thanks to the NFL’s popularity. Moreover, the company’s Q2 earnings on August 17 will also be a major catalyst since investors would want to see improved cost management from the company and growing revenues as that would put the company on the right track to achieve its target of breakeven and reaching profitability in 2025. Given the significance of these catalysts, investors could wait for FUBO stock to retest its support and go long in anticipation of the Q2 earnings report and the beginning of the NFL season.
FUBO Forecast
As things stand, FUBO is the most dominant sports streaming platform due to its wide and diverse range of content. Having said that, the current improved macro environment could help boost subscriptions as real earnings became positive last May for the first time since April 2021 – indicating stronger buying power. With the NFL season set to start next September and the improved buying power, FUBO’s subscriptions could be poised to increase in the second half of 2023 which would signal substantial revenues for the company thanks to it raising its subscription prices earlier this year.

fuboTV: Double Top at the 0.382 Retrace and 200 Day SMAfuboTV right now has gapped up and hit a 38.2% Fibonacci Retrace and is now Double Topping and Bearishly Diverging on both the MACD and RSI at this level. As things currently are, I would expect the gap to eventually be filled, but overall, fundamentally looking at their financials, I think the stock goes down to the 1.272 Fibonacci extension, which would take it all the way down to around 6.18 cents.
