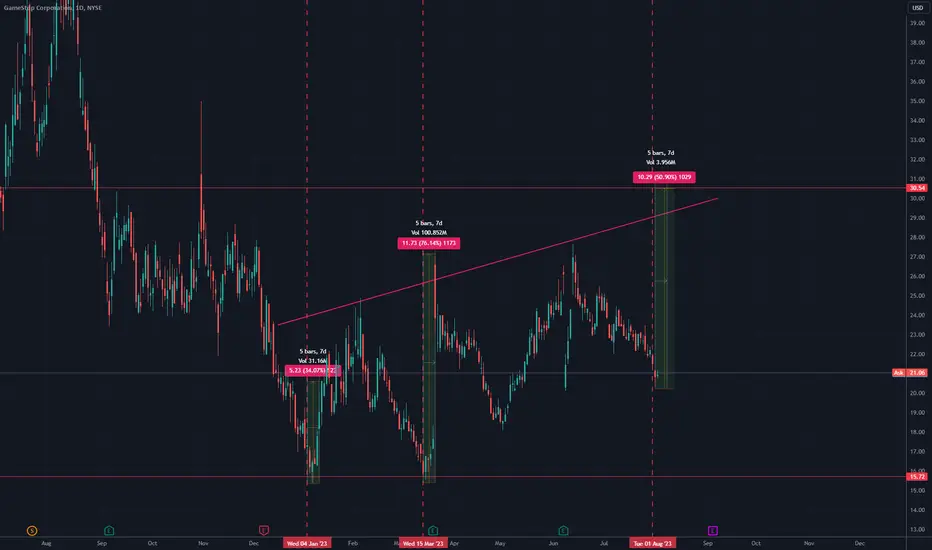
Double bottom on the 15We can see a pretty nice example of a double bottom on the 15 with just over 4 weeks before the next witching. The next few weeks should be pretty interesting.
GME trade ideas

$GME - IEP gapped down = Good for GMEHi guys,
I know it sounds a bit crazy to those who haven't followed me before but as we know, GME runs usually happen after IEP pays it's dividends out e.g this month it would've been on the 17'th of August.
When IEP pays it's dividends, the price gaps down to appropriately mark the company's new value and this is kinda when GME starts moving.
Well, for the first time in IEP's long history, we had a HUGE opening gap.... and it's before it's dividend payout date. It just happened today on it's earnings. Historically IEP doesn't do this at all on it's earnings, so this could be attributed to the recent volatility in IEP due to those short sellers targeting IEP's practices & people having loaded up on IEP calls/puts months ago.
Regardless, my "thesis" on this is simple. All i know is that when IEP gaps down, GME runs immediately 1-2 days after. It just gapped, regardless of circumstances, i think tonight combined with what data i'm going to get from the market, we might have a green light to buy on Monday.
I'm honsetly feeling it, so i'm gonna re-buy in today. I found the IEP connection close to 1.5 years ago since today and this is the first time it does something this "different". I'm in... but a sane person would wait for tonight's data.
$GME - Latest swaps GME is bundled withHere's a composite chart of the stocks GME is corelated with as of 26 July. I've built a composite chart of the likely composition of the swap basket. It's close enough to the real thing.
Yes GME's been bundled with a bunch of Aluminium mineral companies, computer hardware, MBS and real estate holding companies and surely... Xerox.
You should expect that our price will move on this chart's average price which is the whole point of having a basket of such diverse stocks. But yeah... i don't like that GME's been put in a basket with a Mortgage Holdings company and Minerals...
Here's the companies and why they've been picked to be put in a swaps equities basket with GME:
XRX - 25 Jul Earnings (Earnings Pumped 11%, gave it all back ~7 days later)
COOP - 26 Jul Earnings (Earnings pumped 12%, still up there)
BXMT - 26 Jul Earnings (BXMT, pumped 6.96% gave it all back ~7 days later)
CSTM - 26 Jul Earnings (Earnings pumped 10.6%, gave half back ~7 days later)
AFL - 1 Aug Earnings (Earnings pumped 7.4%, still up there)
FCPT - 1 Aug Earnings (Earnings dumped -4%, still down)
ATI - 2 Aug Earnings (Earnings dumped -7.4%, still down)
SO - 3 Aug Earnings (On it's way downwards)
BR - 8 Aug Earnings (Neutral)
GME - 6 Sept Earnings (On it's way downwards)
As you see, these have chained earnings. They did this 4 months ago by putting GME in the same basket as AG and BROS, 2 completely random compnies in different sectors. I think the reason is that each basket needs a spreads gainer & a vol stock or two.

$GME - DownDown for a while. Puts for this week could be a good idea. Can't explain my thesis yet. More to come on this play in some time.
For now, just down.

GME fell. Can it get back up? GME on the one hour chart fell over a week from July 27 until earlier today.
The fall has heavy selling volume this morning followed by a flip at the lunch
session into buying solume above the running mean. Similar findings are on
the volatility indicator. The MACD has a cross under the the histogram as
price momentum shifted from bearish to bullish. Price has crossed over one of the
lower VWAPs in early vWAP uptrending.
Overall, I see this as a long setup. With the market drop today, the volatility gryration
tomorrow is a likely reversion to the mean. This should lend support to the
reversal on GME. My target is the green POC line of the volume profile at 21.18
with a stop loss of 20.25. Once underway with the stock trade if good movement is seen
I will take an options contract or two with one day to expiration.

$GME - Down, then upHi all,
imgur.com
Basically blue is a leading indicator that shows what will happen before with GME's price before it happens.
According to it, the price is going to go down, then in ~2-3 days it will bottom out. After this point it'll shoot up a lot. That's it.
Things to be wary of:
1) Historically, GME shorts like to cover into an elevated Vix.
2) Historically, GME shorts like to cover into a dying market.
Knowing that there is a move UP next week for GME would mean that Vix is expected to spike up and SPY is expected to start dropping. Position yourselves accordingly.
GME is not the one causing all of this, GME is simply left as last to be covered into a dying market in order to defuse the magnitude of the price pop. This is pretty clever.
That's it. I expect the bottom to be in by Friday 04 Aug. I expect a pop sometime next week.
This one is going to be a bit early where normally this pop would happen just after IEP's dividend e.g around the 21'st of Aug.
The data suggests a sudden 1-2 day pop on one side. It may also suggest a possible big initial pop and slow upwards move into the 25'th of Aug before reversing.
Do with this information what you will.
Good luck.

GME buy the dip LONGI see GME on the 15-minute chart as being setup for an opportunistic speculative dip buy.
Details and targets are on the chart. The plan is to get about 5% out of an anticipated
rebound off the near-term pivot low. My analysis is the GME will revert to the mean being
the high volume area of the volume profile which is 4% upside with the POC line before
that where trading will ever be buyer dominate for a continuation or seller dominate for
a bounce down. If any shorts bought in the downtrend they will either hold through the
recovery or buy to cover to minimize losses. If the latter, the early beginnings of a short
squeeze could be a foundation of a move higher.

$GME Last Point of Support - Wyckoff TheoryNYSE:GME 's trading range can be identified as a longer-term accumulation where price dipped below demand zones but regained the very important $22 area. This zone, historically, has provided major support and large upthrusts in volume and succeeding price action when sellers were absorbed and reversals occurred.
Right now, NYSE:GME 's sell-side volume increase (slightly over the last several days) but downward thrusts in price have been diminishing in strength. This is showing me that buyers are stepping up here and we could see a strong reversal in the very immediate future if this level is seen as a "Last Point of Support" in Wyckoff terms.
Fibonacci levels would have NYSE:GME potentially going to test the 1.618 fibonacci extension from the "shakeout" low, swing high, and following "lps" low. This Golden Ratio in Fibonacci is seen as as very popular retracement/extension level and would also make sense schematically before another push down to test demand higher in the range.

Gamestop what will happen next?possibly mini pump if trend holds.
GameStop Corp. is an American video game, consumer electronics, and gaming merchandise retailer. The company is headquartered in Grapevine, Texas, and is the largest video game retailer worldwide.

GAMESTOP WEEKLYRULES:
-If price break Point 2, 4, 6, or 8 cancel the setup
-Price needs to break Point 1, 3, 5, or 7 to confirm the setup
When price reach the 100FE(BLUE BOX) it normally does a pullback/retest or reversal
The market can Truncate(fall short)


GME- Pullback completed Re-Entry REady?GME trended up from the 1st of May into a V shaped retracement and boune from June 7th
to 14th finally crossing over the 2nd STD of the full range anchored VWAP before a
standard 50% Fib. retracement bottoming 2 days ago as seen by the Fib. retracment tool.
Price has now reversed to an uptrend and is crossing both the full range mean anchored VWAP
and the POC line of the full range volume profile. The confluence of the mean VWAP and the
POC line cross-validates them both and adds strength to the thesis of a a return of bullish
momentum. I see this as suitable for a long trade targeting first the red line of the 2nd
standard deviation above aVWAP for 75% of the position and then the blue line of the 3rd
standard deviation above mean a VWAP for 25% of the position. The MTF RSI indicator
of Chris Moody shows two low and high TF RSIs in the mid range. The Lorentzian an AI based
machine learning backtesting indicator has printed a buy signal yesterday morning. About the
same time the low time frame RSI crossed over the higher TF RSI and the 50 level then
MACD lines crossed while underneath the histogram. Confirmations and validations
found, I will zoom into a 5 or 15 minute time frame for a pviot low from which to enter
the trade long.

Is one Gamestop trend line enough? GameStop - 30d expiry - We look to Buy at 21.71 (stop at 20.21)
Short term momentum is bearish.
Prices expected to stall near trend line support.
Trend line support is located at 21.70. We look to buy dips.
We look for a temporary move higher.
This is currently an actively traded stock.
Our profit targets will be 25.21 and 25.71
Resistance: 24.00 / 25.00 / 26.00
Support: 22.91 / 22.15 / 21.50
Please be advised that the information presented on TradingView is provided to Vantage (‘Vantage Global Limited’, ‘we’) by a third-party provider (‘Everest Fortune Group’). Please be reminded that you are solely responsible for the trading decisions on your account. There is a very high degree of risk involved in trading. Any information and/or content is intended entirely for research, educational and informational purposes only and does not constitute investment or consultation advice or investment strategy. The information is not tailored to the investment needs of any specific person and therefore does not involve a consideration of any of the investment objectives, financial situation or needs of any viewer that may receive it. Kindly also note that past performance is not a reliable indicator of future results. Actual results may differ materially from those anticipated in forward-looking or past performance statements. We assume no liability as to the accuracy or completeness of any of the information and/or content provided herein and the Company cannot be held responsible for any omission, mistake nor for any loss or damage including without limitation to any loss of profit which may arise from reliance on any information supplied by Everest Fortune Group.

$GME BullishI cannot remember ever seeing such a bullish setup for NYSE:GME since starting to follow it in January 2021
Yes, there was 1 golden cross before,
Yes, there were many double bottoms before
Yes, there were many confirmed uptrends before
Yes, there were many solid gamma ramps before
Yes, it bounced off the MA200 once before
But all together? No
With that, UBS announced that they completed the take over of Credit Suisse and that they are going to get rid of the toxic assets. And we know that Credit Suisse inherited those from Archegos. And we know it caused the downfalls of both Archegos and Credit Suisse. And we know what caused the downfall of Melvin. And we know there are many others with toxic assets.

$GME taking offNYSE:GME had a double bottom and since them two higher lows confirming an upward trend.
It bounced off the 200 MA and is set to have a golden cross before next Wednesday.

$GMENYSE:GME backtesting massive HTF support after making a potential double bottom and higher low. Interesting stuff. Also not to mention breaks 200 day and back tests it as support.

I only see a huge FLAGHey traders! well, this is a very classic pattern and the earnings are Sep 05, 2023. also seems that it will be a golden cross soon between 50 & 200 MA. What do you think? APE in? YOLO?

GME's Accumulation CompleteNYSE:GME 's recent news (Cohen Chair and buying) seems to have dropped at the perfect time. The tape is reading bullish absorption of supply volume with higher lows and higher highs. If this is correct, Williams Alligator is showing the 'gator emas' eating to the upside on *THE WEEKLY*. This looks like squeeze territory anywhere above $30-32.

GME, UGLIEST DRAWING BUT STILL POSSIBLEI dare you find an uglier drawing but still have a high potential of achievement. This not a financial advice just trying to share my wishful thinking. ER on Tuesday be careful.
Please leave a comment of your thoughts and opinions.
Thanks

GME - Is Gamestop ready for another run ?GME this past week showed a nice reversal as seen on the 30 minute chart. Price hit a swing
low on May 2nd and then rose the rest of the week. Is it riding above the linear regression line
set to draw context and direction. On the anchored VWAP bands GME has crossed over the
first standard deviation VWAP line as well as the mean VWAP. Buying volume has replaced
selling volume in the past 3-4 sessions. GME crossed above the POC line of the intermediate
term volume profile suggesting buyers are taking control of the market
Please comment. What do you think? Is GME getting ready for another launch?

$GME - Huge bull flag - LongNYSE:GME -
We gave an entry at ~$19 on the 3rd higher low from the bottom of the flag -- Swinging on the monthly here we think big things here for GameStop
Swing to top of Flag and beyond!
Push Play / Like /Share / Comment!

GME: Falling Wedge Breakout to All-Time Highs is NearGME recently bounced from the lows on the lower timeframe thanks to a Bullish Gartley and a massive amount of MACD Bullish Divergence and it has since come back down to fill the gap the rise created; now that GME has filled that gap it is going for a second leg up and the RSI is entering the Bullish Control Zone, and soon it will be Bullishly breaking out a macro falling wedge pattern which if it breaks, I think could take it up to the levels of at least $120-$135

Gamestop may rally after a Bullish ConfirmationGameStop has entered an accumulation zone on the daily timeframe, indicating a period of consolidation and potential price reversal. To anticipate a bullish rally, confirmation of a breakout above this zone is necessary. Furthermore, there is a significant daily support level near the current market price, which has been preventing a downward break. Monitoring the price action and waiting for a bullish breakout confirmation will provide more clarity on the potential direction of GameStop's price movement.
