GMe Since the breakout I discussed GMe has rallyed from 18.45 up to 21 area. Cureently it is sitting just under 20.90. Multiple taps of this area. Seems the trend is getting tight. We are looking at either a big breakout up or a roll over soon. Personally I’m still in the camp GMe has room to the 22.50s at least but tough to sta exactly where we will break coming soon. I’m still postioned long. Looking for a pop if 21$ and start to consildate on top of it. I feel that if we lost 20,53s this may be looking to head back to retest that strong 20$ level down to 19.50.
Be careful with how you play this, def use stoplosses but might b worth a risk long with stops 20.48s -52s
GME trade ideas

GME 2023 $ Squeeze Target we bounced from our support above the 15$, now we need to clear the resistant around the 22.20$, to continue this bullish momentum till the 25.50$, then the critical area of profit taking + rejection if we didn't clear it, will going down to have a reversal from the 10$ bottom for this year .
if we clear that critical area (32$/35$) we going to have squeeze till 85$, which will make the mega squeeze for GME once again .

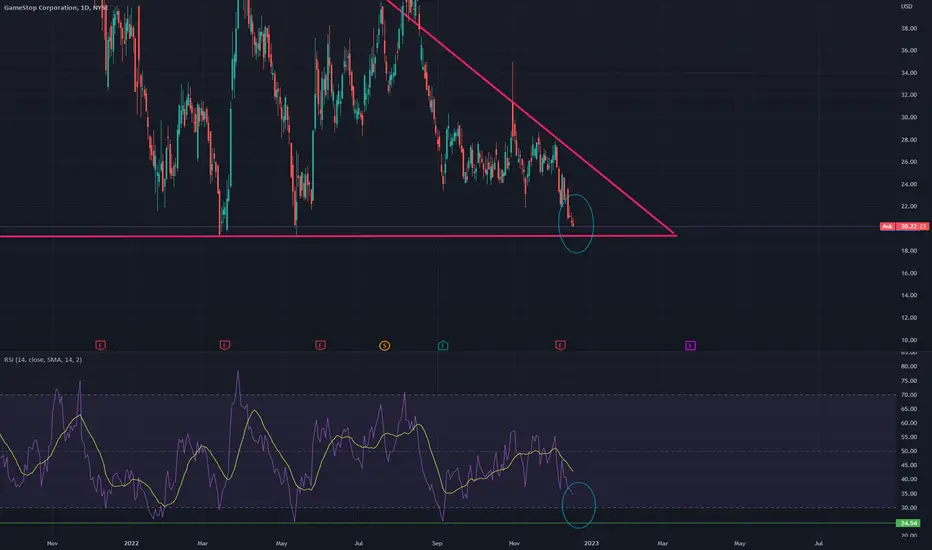
GMEThis is something to watch here as we can see from my green reistance zone that we broke above so far, launching us to a monster reistance if 20$
This previous zone was from 17.95-18.40 area. We are currently attempting to flip it to support. On smaller tomframes we have caught a few reistance taps at 19.20 and the biggest reistance of 20$ which was support before the floor dropped out.
I have entered a postion at the red arrow at an averge of 18.44
I’m waiting to see if we can retest and continue to hold this previous zone as new support but hard to say for sure how we will react. This last test we launched off that 18.40 area so if we can test again and still hold this could be what we need to break through the 19.20 and ultimately 20$ level.
Keep in mind a drop to 17.95 area is still ok but could set us back into a previous reistance area.
Overall it’s still uncertain but hold low 18s could be a banger of a trade buy

Gamestonk Broke out then pulled back
Bullish divergence
Some targets marked
Can fake out again depends on cpi number short term
When the real breakout comes can be a 10-20 bagger
NOT TARDING ADVICE
GRI2023

It is time.. for a vacationWhy type many word when little word do trick.
Ideal setup, catalyst probably needed, just the truth.
as you can see by my drawing.. i need a vacation.
pay me


GME - RSI indicating near term POPJumping on the band-wagon with a long here on the Game Stop.
GME daily chart with RSI and VWAP indicators showing that a potential near term rise in price is anticipated. The approx. 10 week down cycle is perhaps ending today with the last interim high occurring on Halloween 2022.
Last two times the RSI volume indicator was this low (Dec 2021 and March 2022) Game Stop had a nice POP. Expecting a price jump to occurr fairly soon to corelate with the middle of RSI channel and perhaps more. Long Jan and March monthly calls. NFA.

15min Cup and Handle on GMEWe can see some movement within the falling wedge on the 1hr with a cup and handle forming on the 15! Keep an eye out on for a breakout on both.

Bearish channel situationOn GME as you see on the chart we will have a big probability of an uptrend continuity because we have the breakout of vwap indicator and also the breakout of the resistance line. But we must be vigilant.Thanks.


GMEJust about there. One more quick flush should do it imo. Might even look to get long in the $12s but we'll see how price reacts once demand is hit.

GME Accumulation ZoneIf you believe in the future of this company, its starting to enter a great accumulation zone. Can previous highs of the past decades now act as support for this stock?

Big probability of a downtrend: good spring effect on vwapAs you see on the chart we have a good spring effect on the vwap indicator so,it's mean that we will have a big probability of a downtrend.Thanks.

$GME - Load up Zones $19.5 and $17.xxBe sure to load up responsibly at the correct zones. $19.5 and $17.xx are decent prices to get in. Always save some cash to buy more later at lower prices. Don't go all in at current prices.
I've loaded up on March calls $20c for around 1/4 port value. I'm ready to get more if we dip more at $17.xx will probs get $18c for the same expiration.
Sorry for switching between long and short so erratically but i've got to follow events as they unfold.

gmeamc has broke down for me this looks textbook for a breakdown broke previous support which it bounced twice, just tryingg to amylase all market before the new year when I go guns blazing in the market learnt so much this year really cat beat time in the market and seeing set ups happen.On that note for me alot of stocks looks ready for a breakdown to me

Falling wedge and RSI just broke below 30!Every time RSI breaks below 30 we see a reversal and a 50 to 150 percent gap up. We just broke below 30 on the daily and at the end of a falling wedge. With the next swing block sitting up at $40. All the factors are saying this is about to squeeze again.

GME 9/19/2022Daily chart analysis.
Adding to existing trade.
After rejecting higher prices and falling back below resistance @ 37.95, price broke thru and fell below minor support level at 29.00.
Price has pulled back to support at 29.00 and looking to turn it to resistance.
Price currently at area of value. Cue to enter.
Adding to existing trade
Entry: 28.60
Stop loss: 22.20

GME: CTB on the rise can price go back up to $40?Hey everyone,
As always not financial or sexual advice. That being said, every time the CTB rises drastically there has been a sharp increase to the upside in price.
March 15-24th 2%-22% increase of ~153%
May 19-25th 8%-50% increase of ~64%
July 21-22nd 32%-124% increase of ~ 20%
Dec 19 - Present 8%-27.7% increase of ???
Fibs suggest a downside of $18.40 and $17.61.
Good luck!

GME - Falling wedge getting tighter
The 18-month falling wedge is getting tighter and tighter. If you believe in the stock, then I´d wait for a break of the wedge´s top trendline.
When falling wedge´s break, I usually have 2 initial targets:
- the middle of the wedge
- the wedge´s starting point (its top)
These targets would already give a major upside gain... but again: if you believe in the stock.

$GME - Turned Bullish, but what about the rest of the market?GME is looking super good today. Shorts increased their positions by another $25mil which is extremely bullish for GME in terms of making the price increase/run or whatever you want to call it. It looks like the run is happening after all.
You need to however take the rest of the market in consideration before getting too happy.
For the past few cycles, GME has done it's thing into a bearish market. One example was when CPI/FOMC was on the exact same day as a run (twice actually) and the run got crushed. Another example was when AMC gave out it's dividend 1 day before the GME run and 1 day after the GME run was the TSLA split. There were plenty more instances where GME just did it's run into a dying market.
EOD Data
-Looking at the EOD data for GME, as i said things are looking super bullish. A run is going to happen for sure.
-Looking at the rest of the market, i'm not sure what's about to happen e.g i can't tell. If the rest of the market does not die starting tomorrow, the run should be a good one and would touch in my opinion $40 for GME. If the rest of the market starts dying tomorrow onwards, i think GME could make a new low at $17.xx.
Positions: SPY Puts, AMD Puts, Coca Cola Puts.
I could've kept my GME calls but i'm not feeling this one even if the GME data is clearly saying things are bullish. This means #1, i'm a week early and #2 you're all about to get rich. So, good luck. I really hope GME doesn't get pumped whilst the market is dying for whatever random sudden news comes out tomorrow...
TLDR:
-Data says GME go up for sure.
-I'm not feeling it, so i think it's going to $17.xx
Data is almost always right, i'm alost always wrong. Cheers.

$GME - Load up, a lotMy previous target of $19.40 ish is almost there. The biggest loading zone is here. My entire port is now on GME calls.
No PT from here, i only know that $19.4 is an extreme support. If broken by a lot and for more than 1-2 days, god save us all.

$GME - Load up, only a little bit...My data doesn't indicate a run for GME this time.
I'm thinking there's a possibility of a run on 21 Dec -+1 day as usual. The only indicator i have to rely on that might support this is the idea that the market always pukes on or until SPY Dividend dates (16 Dec) and then starts to recover immediatel the week after. There are some exceptions where the dump on SPY dividends can last +1 week thus ruining any hopes for a rally.
I'm hedging my SPY puts with GME calls and SPY calls for the moment. Not fully hedged, only partially buying GME and SPY calls because i'm not sure whether next week will be a thing. Need to see today's and Monday's EOD data for that. Needless to say, GME's resistance is at $19.4 and that's where you should at least load up a bit or even from where we are right now. Anything below this resistance and i would personally consider completely removing this stock from my watchlist at this point since there's more easy places to make money at.
Don't go all in on calls, if you have puts, keep them and only buy a handful of calls. There's 0 guarantee for anything happening next week. I'll update this post once i have more data and if the data indicates anything good.
Load up when
RSI is oversold
GME is below $20
That's my opinion
Daily Falling wedge on GME has just entered the Discount ZoneLooking at this Falling wedge on the daily, a breakout of this wedge could be substantial and shoot this stock back into the 40s with ease. SI is on the rise as is IV, Also SMC showing GME has just entered the Discount zone and grabbed a pretty big block of liquidity. Prem zone on the Daily is sitting in the $43 dollar range.
