GS trade ideas

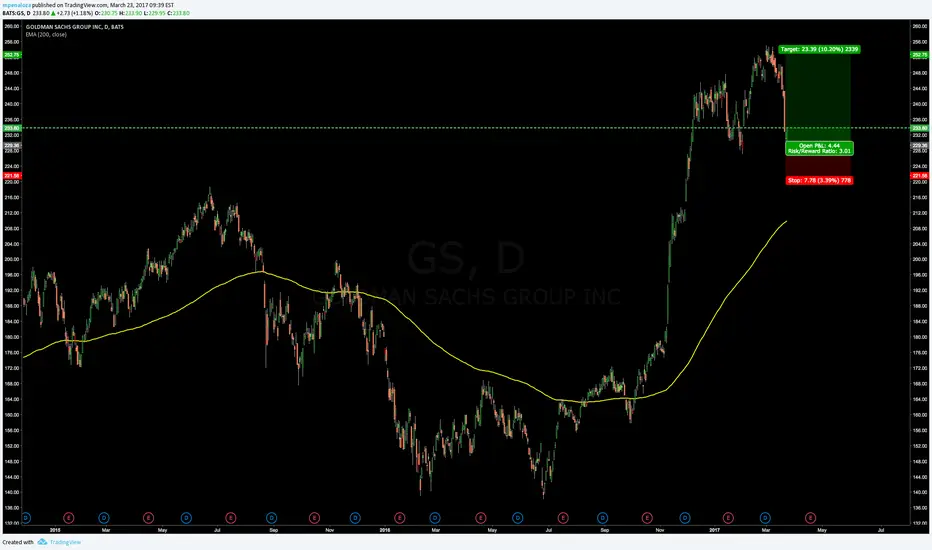
Long Goldman Sachs Group Inc.we ile a lot the set up for this stock. The 230 support looks like its working fine, we would be looking for long positions towards the 252-254 support. We are looking for a last bull rally in the markets before a massive sell off in the third and fourth quaters of this year
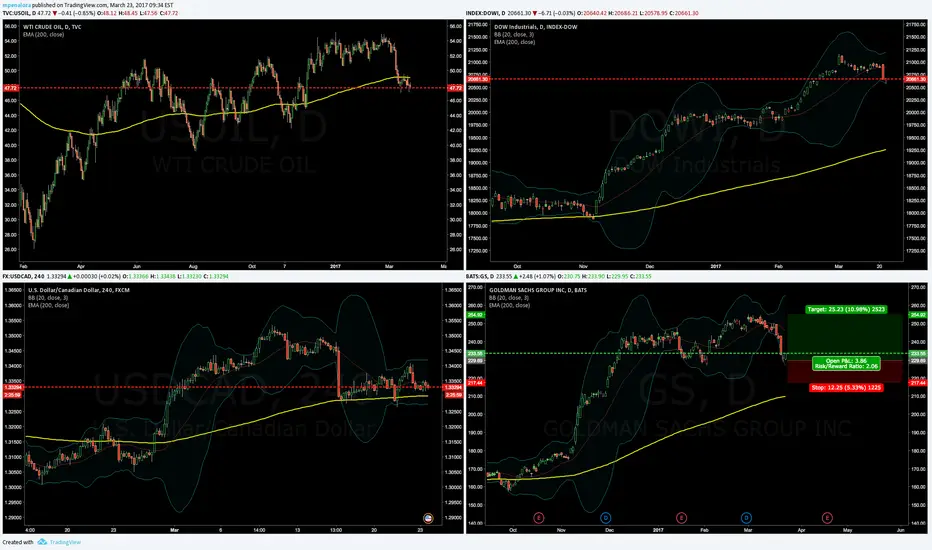
Long Goldman Sachs The financial sector is having a tough week. Today the sellof looks like its pumping the brakes, and the set up for Goldman Sachs looks really nice. The support @ 228 looks like its working just fine, and we could be looking to take long positions towards the 250-254 ressistance.
Goldman SachsBuying the pullback here in GS. Looks like an exhaustion of sellers is likely at this level, should cause a price to pivot here IMHO.
Entry: $243.39
Target 1: $256
Stop Loss: $240.99
Reward to risk ~ 4:1

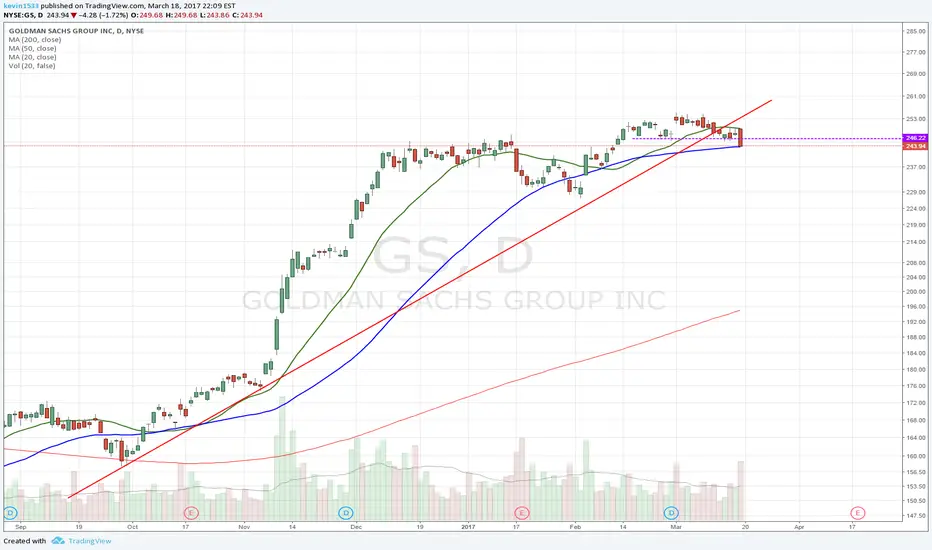
GS Analysis #2Here you can see that the stock is moving along a potential resistance point. Waiting...

Goldman Sachs - rising trend breached amid flatter yield curveA flatter yield curve us bad news for the banking stocks.
Bearish price RSI divergence followed by a breach of the rising trend line suggests the 50-DMA support of 243 could be put to test.
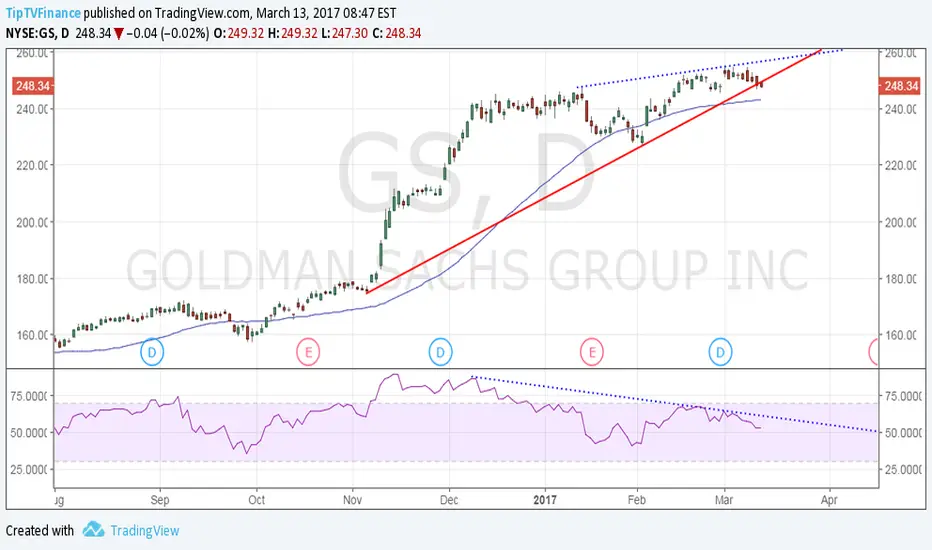
Goldman Sachs - Flattening yield curve, bearish outside day Correction could gather pace as the treasury yield curve continues to flatten. Meanwhile, we have a bearish price-RSI divergence and a bearish outside day candle on the daily chart. The share price could drop to 230 levels


Goldman Sachs 'Agnostic' On Gold PricesGoldman Sachs analysts say they are “agnostic” toward gold, looking for the price a year out to be only slightly above current levels.
Gold has rallied a little more than $100 an ounce since the metal hit its December low, with Goldman saying the bounce has been in line with other market moves, such as long-dated U.S. real interest rates, and shifts in sentiment towards U.S. growth and wealth creation.


Goldman Sachs outlookDo I need to say why? Wait for bull count to hit 0. Gap in bull count confirms bearish trend. You are welcome.


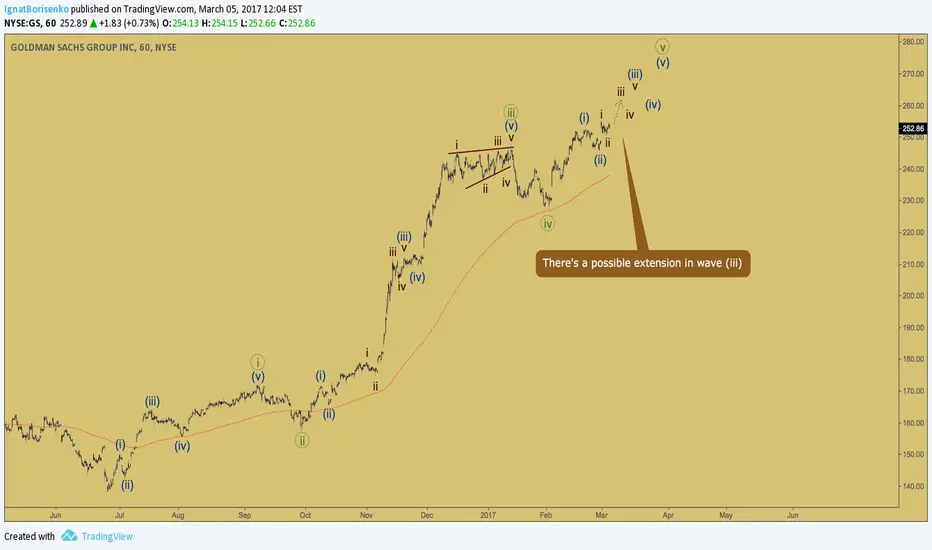
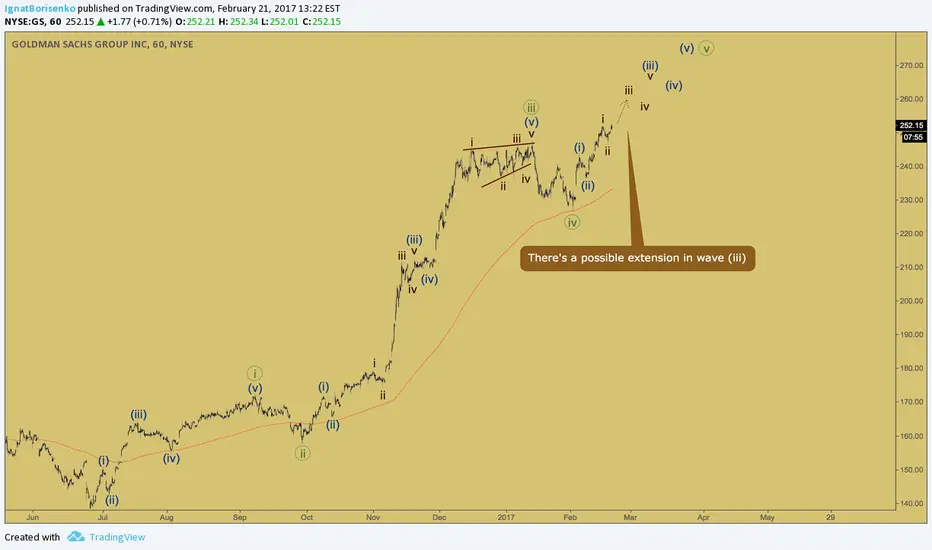
One more push before we hit a soft patchA while back I published a chart of the Dow Jones suggesting the market had more upside potential and now I am showing you a chart of Goldman Sachs that is telling us we should see one more push before the market retreats with an unknown intensity. On thing for sure the next push up would be a good time to take some money off the table. An ideal target would be 261 where we have equality between wave (i) and (v) but the minimum requirement is just to push above 247.
While it would be great if GS just spike up right now, keep in mind there's no way to tell if its wave (iv) is over or not. So just be patient if we keep moving sideways for a little while.

Goldman Sachs BullishDue to recent Trump's pull back on Dodd-Frank regulations.
4 GS alumni in Trump's cabinets
News and chart contribute to bullish manner


GS @ 1h @ it smeels like an shortterm selloff, last trading daysTake care
& analyzed it again
- it`s always your decision ...
(for a bigger picture zoom the chart)
Best regards :)
Aaron


