SYMMETRICAL TRIANGLELarge and loose triangle. Tight triangles perform best.
Top line slopes down and bottom line slopes up.
Neutral until broken.
Engulfing candle today but this is a bad market day. This candle needs confirmation.
No recommendation
GS trade ideas

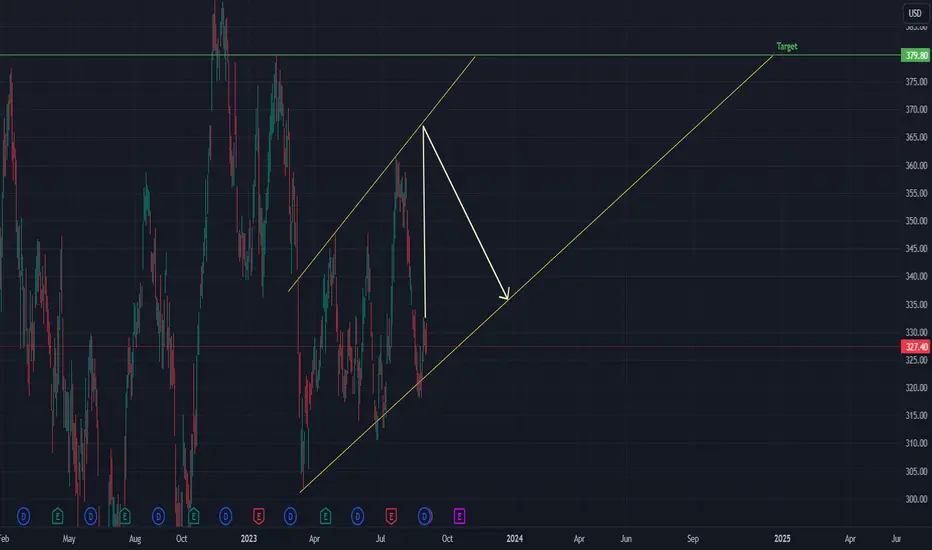
Symmetrical Triangle//Weekly ChartThis Triangle is long and kind of narrow on daily and is better seen on weekly.
It is hard to calculate targets for a Symmetrical Triangle as some would calculate the targets from the point of the break and this one is not broken.
Top line slopes down and bottom line slopes up.
This pattern is neutral until broken.
No recommendation.


Goldman Sachs TAHey guys it’s Amir what’s up?
I’ll go right into it.
- GS is trading between support and resistance since October.
-We have a similar double bottom like we had couple of months ago
- we have a gap at the resistance and I LOVE gaps I believe they always get fill
- at the 4 hour interval we have a bullish divergence
Right now I’m waiting for final confirmation at the daily interval of the REVERSAL MACD and and the Stochastic.
Keep following up buddies

$GS Head & Shoulders Patternkeeping an eye on a potential Head & Shoulders pattern in the stock of Goldman Sachs (ticker symbol: NYSE:GS ). The Head & Shoulders pattern is a popular technical analysis pattern used by traders to predict potential trend reversals. It typically consists of three peaks: a higher peak (head) between two lower peaks (shoulders). The pattern suggests a potential reversal from an uptrend to a downtrend.
Here are some key points to keep in mind when trading or investing based on this pattern:
1. **Confirmation**: A Head & Shoulders pattern is only confirmed when the price breaks below the "neckline," which is the line that connects the lows of the two shoulders. This breakout typically signals a bearish trend reversal.
2. **Volume**: Analyzing trading volume can be crucial. Ideally, you'd like to see declining volume as the pattern forms, followed by a noticeable increase in volume on the breakout below the neckline. This increase in volume adds more credibility to the pattern.
3. **Price Targets**: Some traders use the height of the head to the neckline to estimate a potential price target for the downward move after the breakout.
4. **False Signals**: Not all Head & Shoulders patterns work out as expected. Sometimes they can be false signals. It's important to consider other technical indicators, market conditions, and fundamental factors when making trading decisions.
5. **Risk Management**: Always have a clear risk management strategy in place. Determine your stop-loss levels to limit potential losses if the trade goes against you.
6. **Market Context**: Consider the broader market context and news related to the specific stock and industry. Market sentiment and external factors can impact the success of the pattern.
7. **Timeframe**: The effectiveness of this pattern can vary depending on the timeframe you're trading. It's often more reliable on longer timeframes, but it can also be applied to shorter ones.
Remember that no trading or investing strategy is foolproof, and past patterns are not guarantees of future performance. It's essential to conduct thorough research and analysis before making any trading decisions. If you're not experienced with technical analysis or trading, consider consulting with a financial advisor or professional who can provide personalized guidance based on your financial goals and risk tolerance.

Goldman Sachs is currently consolidating between $328 resistanceGoldman Sachs is currently consolidating between $328 resistance and $318 support. A breakout of either level would provide further trading opportunities. Specifically, a daily close above $328 may extend this recent rebound towards the $335.69 level while a daily close below $318 support may drag prices towards the $312.48 support.

Goldman Sachs - Are Banks The Next Dumpster?Goldman Sachs is another one of those stocks that's traded like a can of dog food for a very long period of time that the masses are really drawn to, much like Target, Disney, and Paypal, of which you can find calls for that I've made in the linked section below.
GS is relatively significant in that it's one of the 30 components of the Dow, which is one of the big three indexes.
The Dow had previously been the leader in strength, and for a long time, but in the last several weeks has become the leader in weakness.
Although it looks like a minor blip on the radar, I feel it's something of a harbinger of doom.
And the problem for Goldman Sachs can be seen clearly on the monthly:
Clearly insofar that the bounce from the 2018 high should have lead to new highs.
Instead, the distribution block from the market highs served as resistance. 14 months later, it took out July's low and we can now safely theorize that lower prices are in order.
Weekly bars show us that a failure swing has formed and July's price action was just a local stop raid.
So, what could a catalyst be? Arguably, there doesn't need to be a catalyst. It's just that JP Morgan is long 15,800 puts with a strike of SPX 4,225 expiring September 29 that have never been in the money since they were purchased at the end of Q2.
And so when one index falls, all indexes falls, and the arbitrage algorithms naturally take component stocks down with them.
There's also the economic disaster China under Xi Jinping and his Chinese Communist Party are facing. When you have a disaster hit the world's "Central Kingdom," nobody is an island and those macro equity flows will cause significant turmoil in other markets.
For the U.S. market makers, this simply represents an opportunity to kill longs, buy everyone's losses at the bottom, and rip it back to new highs while you short sell and chase the entire way because Reddit and Discord and Xeeeeeter told you to.
But "the best laid plans of mice and men often go awry."
What looms over the head of humanity is the CCP's 24-year persecution of Falun Dafa's 100 million practitioners in Mainland China, which was launched by former Chairman Jiang Zemin on July 20, 1999.
Although Jiang is dead now, the persecution still continues. Xi hasn't been a part of the persecution. Xi, to the contrary, has been killing the participants of the persecution in his "Anti-Corruption Campaign."
But much of the world has gone to Shanghai to do business with the Jiang Faction and that requires swearing vows to the Red Cult's Flag of Blood and leaving collateral.
This is going to be a roadblock to the future for the U.S. "systemically important banks" that cannot be passed, and the impact is going to be significant.
So, here's the trade on Goldman Sachs.
The target the algorithm is set up to pursue is definitely $275. Shorting from $320 actually really isn't that bad. Getting $45 on a put will do rather well for you even if you can only afford one.
Although optimal entry was definitely the $350s.
But the truth is that you aren't likely to be able to long $274 profitably. I'd say the first place you can look for a reversal or a meaningful bounce is $223.
Humans won't believe it until they see it. But once you see it, it's too late.
It only counts if you do something for yourself while the cards are still face down.
Just like poker, the river is coming, and there won't be any "running it twice."


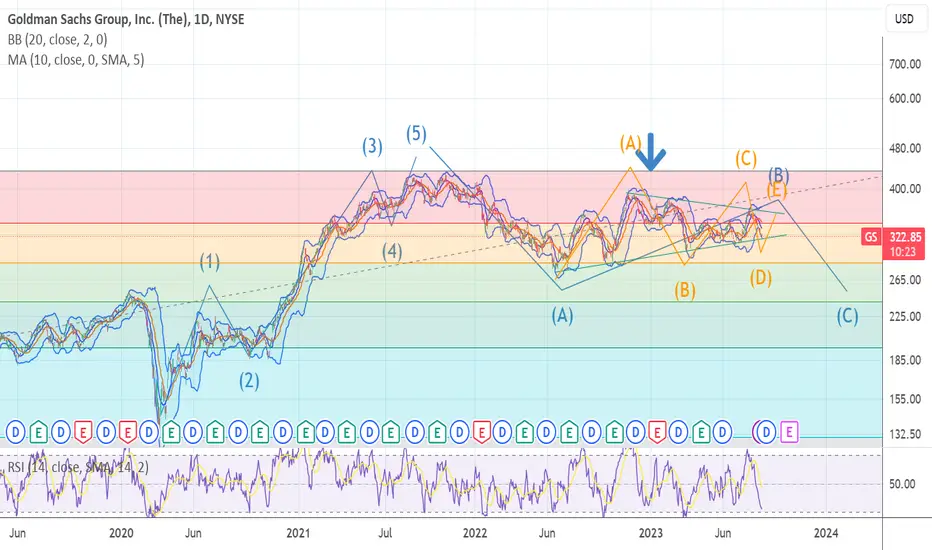
GOLDMAN SACHS wave D n place wave E up is ready super cycle BThe chart posted is my labeling of GS to which I feel that we are ending wave D down within a large sideways triangle to which I am labeling it as a WAVE B . I will now look for GS to rally but under a very labored bull phase CAUTION is and should be used for long and I.T. traders
Goldman Sachs ($GS): Correction Incoming?Goldman has been forming a descending triangle from 11/01/21 to present, with consistent lower highs and a demand zone from $278-$313. As we've most recently been rejected from .236 fib retracement line, price action is showing an imminent retest of the demand zone, which could lead to a 11% - 21% downside potential.
In addition, NI has steadily been decreasing each quarter with Q2 '23 showing a -58% YoY growth, and EPS as well has been consistently getting crushed, with next earnings coming in October.
September has been historically a neutral to downside month in overall returns, and alongside commercial credit getting crunched, Theres a whisper in the air of a well needed market correction, and Goldman is looking to be a variable in this equation.


Goldman Sachs Group WCA - Symmetrical TriangleCompany: Goldman Sachs Group, Inc.
Ticker: GS
Exchange: NYSE
Sector: Financials
Introduction:
In this analysis, we are examining Goldman Sachs Group, Inc. (GS) on the NYSE, a key player in the financial sector. The weekly chart indicates a potential bullish reversal in the form of a classic Symmetrical Triangle pattern that has been forming over the past 287 days.
Symmetrical Triangle Pattern:
The Symmetrical Triangle is usually a sign of indecision, in this case, it seems to be acting as a reversal pattern after a downward trend.
Analysis:
Goldman Sachs' previous trend was downward, represented by the blue resistance line. However, this downward trend seems to have been interrupted by the symmetrical triangle pattern, suggesting a potential reversal.
The price is above the 200 EMA, indicating a bullish environment. Currently, it appears that the price may close above the diagonal resistance. Confirmation of this should occur when the candle closes. If it does, a long position could be considered. The price target in the event of a successful breakout would be 453, corresponding to a rise of about 32%. A minor resistance could be encountered at 420.
Conclusion:
Goldman Sachs' weekly chart presents a promising bullish reversal setup. If confirmed by a breakout above the diagonal resistance, this could offer an attractive long trading opportunity.
Please remember, this analysis should form part of your overall market research and risk management strategy, and is not direct trading advice.
If you found this analysis helpful, please consider liking, sharing, and following for more insights. Wishing you successful trading!
Best regards,
Karim Subhieh
Disclaimer: This analysis is not financial advice and is intended for educational purposes only. Always conduct your own research and consult with a financial advisor before making investment decisions.

Ascending Triangle Within a Symmetrical TriangleLoose triangle with open spaces noted.
Tight triangles perform better than loose triangles.
Strong candle today so far, but has stalled for now at a horizontal and a diagonal resistance intersection. Like traffic intersections are the most likely area for a fender bender or a wreck.
Intersections in a chart can be the same. These can be a tough resistance zone to get through, but by no means is it ruled out and stocks do it all the time.
No recommendation.
Who enjoys being manipulated? LOL Not me
Earnings miss.
Possible computer algorithms firing to complete a pattern. I have no clue. Volume bar does not match price move.
No recommendation.

GS The Goldman Sachs Group Options Ahead of EarningsIf you haven`t sold GS here:
Then analyzing the options chain of GS The Goldman Sachs Group prior to the earnings report this week,
I would consider purchasing the 330usd strike price Calls with
an expiration date of 2023-7-28,
for a premium of approximately $5.55.
If these options prove to be profitable prior to the earnings release, I would sell at least half of them.
Looking forward to read your opinion about it.

GS Pre Earnings LONGGoldman Sachs pivoted from a low on July 11th into a trend up until July 14th during
which it pulled back. Since earnings are on July 19th, I see room now for a pre-earnings
long entry. The MTF RSI indicator shows the lower TF RSI in blue reflecting the pullback
while the higher TF RSI in black shows the longer trend up with the RSI holding support at
50. The zero-lag MACD shows a line cross under a slightly positive histogram suggesting the
pullback will reverse to continuation. Overall, I see GS as being suitable for long entries
which I will take as call options. I will zoom into the 5 or 15 minute chart and look for a
pivot low as the ideal entry. I will set a stop loss of 10% while taking one contract as
a strike $330 expiring July 21st and another $330 expiring July 28th. I have picked targets
based on the upper standard deviations of the VWAP bands anchored back to the pivot
low on July 11th. Overall, I am expecting a 100% ROI on the two contracts.


Can Goldman fall to $250? Bearish divergence on the weekly time frame indicated a bearish move. Which has already happened, giving up control from the bulls to bears. Creating a lower high which could indicate a upcoming move towards $250.
Over bought stochastic and Market exhaustion of the RSI to the upside. Could support my analysis which means NYSE:GS could fall 24-38% in the coming months.
This low would also provide perfect buying opportunity for the overall bullish annual trend.


$GS Trade Idea - Bank Stress Test With the Bank Stress Test showing positive results, here's a possible trade gameplan for GS into qEnd provided conditions are met and we have a bullish reaction to GDP + Unemployment numbers in pre-market tomorrow.
The path on the 15 min chart looks messy since that's the lowest resolution I can publish, so I've included a 5 min version in the screenshot below.
Ideal Gameplan:
1. Price opens above risky area shown on chart and holds above the orange rectangle on the pullback
2. Long 6/30 $325C or $327.5C
3. Can cut some at 10 am if you wish, or hold for the push into 11:30
4. On the first decent pullback after 10 am, grab some $330C "lottos" if you've scaled out Cost Basis from the initial call position
5. By 11:30, price should've made an HH that will only be exceeded near the EOD or on Friday morning (can trim most/all of $330C here if you want)
6. If above conditions are met and price continues to base above $327.50-328 during the afternoon session, can look to re-enter $330C for the late-day push, holding final runners for Friday, but keep in mind there will be theta burn overnight
Note:
If price opens in the orange box shown, or enters orange box during the initial pullback after open, it's best to wait until the orange box is safely cleared, as there is a chance we backtest the afterhours PA under $320


