GTLB trade ideas

GTLB strong buyWe tested the trend channel successfully.
Entry price: 63 (after touch 61.5)
Target price 1: 68 +7.9%
Target price 2: 78 +23.8%
Stop-loss: 60.8 -3.5%
Period length: 20-22 days

$GTLB Potentially Setting Up AgainI want back into $GTLB after a couple of really nice swing trades in the stock recently.
I wont let this stock go into stage 2 without me in it.
Potentially setting up again.

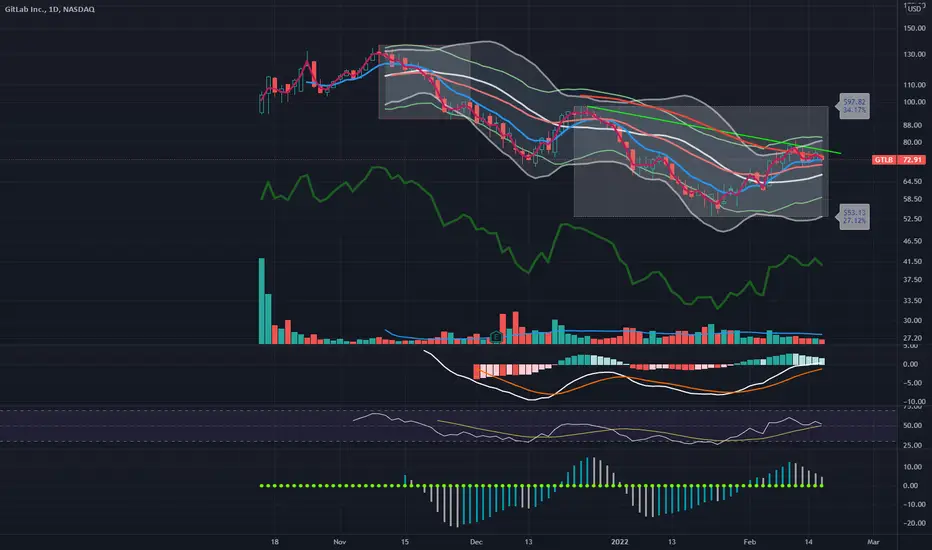
GTLB AnalysisPrice is currently on an uptrend and mitigated the bearish POI at 69.99. Right now, I'm expecting price to do a retracement back to the bullish POI at 59.39. Take note that there is a lot of sell-side liquidity being built. Price could very likely go lower before we see any further up moves.

$GTLB Future Possibilities At Resistance $69.24. Breakout and next area of concern is $93. Failure to break above, expect it to drop into the low 60s & upper 50s.

$GTLB Needs over Anchored VWAP$GTLB Needs to breakout over both Price Resistance area and YTD AVWAP to be a viable trade for me. Look how both of those confluences have acted to reject price recently. I will be looking to take this long after it breaks over and retests the breakout. No rush on this one but looks to be setting up nicely. Maybe one for your watchlist too. Ideas, not investing / trading advice.

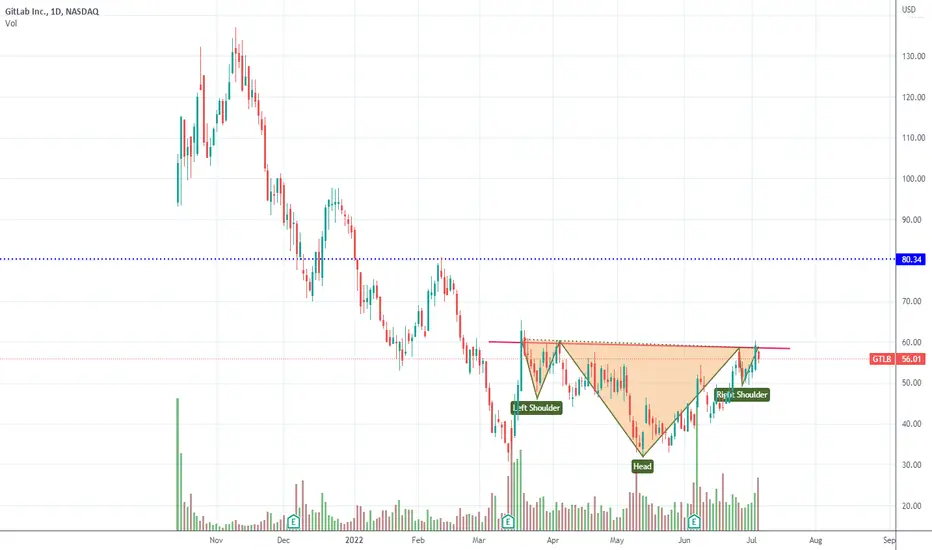
$GTLB Gitlab. $60 Neckline for an inverted head and shouldersGitLab Inc. is an open-core company that provides GitLab, a DevOps software package that combines the ability to develop, secure, and operate software in a single application.
Date launched: 2014
Employees: 1,630 (January 2022)
Formed and inverted head and shoulders. Wait for a $60 daily close (Break of neckline) for a long and a price target of $80. Be nimble. Don't fall in love with the long side.
$GTLB keep 👀on itGitLab, Get Ready.
resistance is tested, the more likely it is to fail as supply gets chewed through.

$GTLB Continue to SetupI bought a starter position of $GTLB on the 28th on a pullback buy setup.
would like to see it calm a bit below right shoulder supply line.
If it does so, would like to build up my position while its coming out (orange bars).

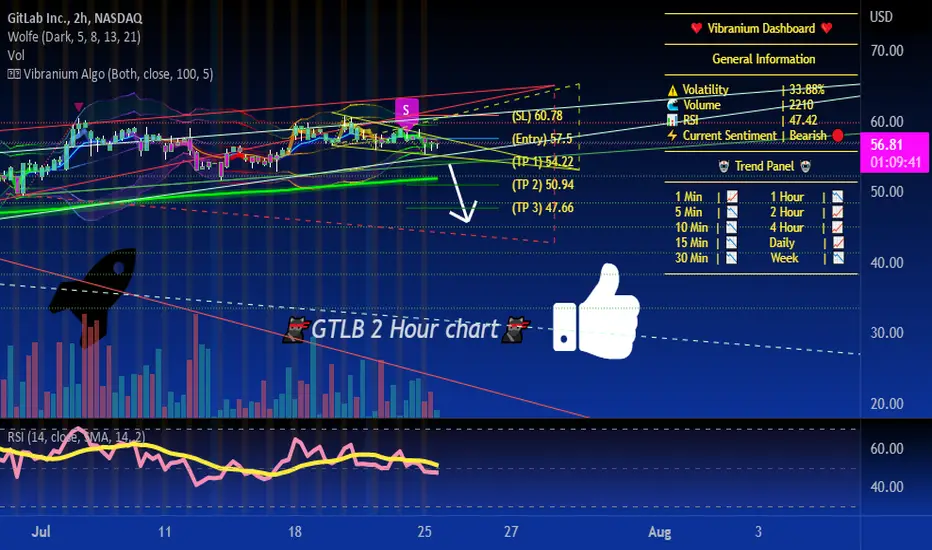
#GTLB $GTLB in bullish uptrend, watch for break 🥵bounce from trend support can lead to a small bounce, but on the break of trend support we will see 54.2-50.9-47.6
$GTLB a Promising Young StockLots to like about this young stock $GTLB
No 200 day MA yet on this IPO
50 MA turned green 3 weeks ago
Not profitable yet but amazing sales growth or 8 straight quarters.
& Lastly, potential head and shoulders bottom that is getting tight on that right side.

US Stock In Play: $GTLB$GTLB - Technology | Software - Application
another tech name; resilient in RS, trading to its rising 10/20 MAs, based at $32 major support since March. have reported stable, increasing qtr sales number since IPO.
currently trading just beneath its IPO VWAP, similar to $DUOL

$GTLB Watch for a move above $54.5This stock has been working well off the 50day moving average. Move above $54.5 will possibly run much higher. Target $60.
I'm watching $54.5 for starting an entry. NASDAQ:GTLB

How to spot relative strength in a weak marketWeak markets are the best time to pay attention to what's actually holding. When stocks hold in weak markets it usually means institutions are supporting price - they're accumulating the stock vs dumping others.
The simplest way to identify this behavior is to compare the divergence in new lows against a benchmark that's relevant for the stock. In this case, I am comparing GTLB to the Nasdaq. Notice how new lows in the Nasdaq are not replicated in GTLB - this is a sign of developing relative strength.
This does not mean this behavior will continue - it needs to be monitored on a continuous basis so that the pattern of strength is maintained in the stock you're watching.
If you're watching a stock that's making new lows while the index is making new highs, odds are when the index rolls over, the stock you're watching does worse. On the flipside, when the index bottoms and regains strength, the stock that showed prior strength should, in theory, outperform as it has throughout the period of weakness in the markets.
The biggest winners of our time always shine in bad periods by simply not falling more than others, and making higher lows when others make new lows - these are the clues you need to watch for.
I want to see GTLB develop more and consolidate on the daily time frame to further prove to me it's in a stage 1 base. So far it's one of the few out there among relatively new IPOs that are showing positive signals. There is still a lot to go and we are in a very dangerous market, so extra patience is needed for price to prove itself.


Long Gitlab from $31,50 (Industry insider) - multi month tradeMy first trade of the year, picked up some shares a few weeks back. Looking for fibonacci targets. As a industry insider, I experience the force behind this stock on a daily basis. Gitlab is entering key technical maturity. Pay attention…

GitLab staggering. GTLBWe are not in the business of getting every prediction right, no one ever does and that is not the aim of the game. The Fibonacci targets are highlighted in purple with invalidation in red. Fibonacci goals, it is prudent to suggest, are nothing more than mere fractally evident and therefore statistically likely levels that the market will go to. Having said that, the market will always do what it wants and always has a mind of its own. Therefore, none of this is financial advice, so do your own research and rely only on your own analysis. Trading is a true one man sport. Good luck out there and stay safe

5/4/2022 NASDAQ (GTLB)Buy (Entry Price) within the buy zone area and exit (Stop Loss) below the red line. Can take profit at the suggested Target Price.
Entry Price: $59.10 / $57.16
Target Price: $62.40 / $60.75
Stop Loss: $53.53

30/3/2022 NASDAQ (GTLB)Buy (Entry Price) within the buy zone area and exit (Stop Loss) below the red line. Can take profit at the suggested Target Price.
Entry Price: $58.08 / $55.23
Target Price: $61.45 / $58.15
Stop Loss: $52.30

GTLB fantastic stock for longHey folks, here is another great stock for long! It's a very strong stock and looks bullish for breakout!

GTLB is on bottom of the channelGitlab, the DevOps oriented IT company
53 is the target, closing the day below the channel is stop

$GTLB 135.65??
This chart shows an up-trend with good volume, breaking the down-trend.
The strong support level at 20MA and 50MA.
Fundamentally, GTLB revenue grew by 64.5% over the past year. BUY!

Watch for short squeeze on this softieWatch for a move above the marked trend line. Over 60% short interest is an excellent candidate for squeeze. Wait and watch NASDAQ:GTLB