LONG SWING HOME DEPOT 1DFUNDUMENTALS
weak earnings but bullish overall gives opportunity for discount buy.
TECHNICAL
1.On the 150 EMA that the price bounced the previous times
2.STOCKASTICKS oversold
3.Strong support at 215-218 level
wait for a confirmation of reversal
R/R is good.SL below the 150 EMA
HD trade ideas

Home Depot - channel trading strategy, potential longThere has been an aggressive selling of the stock for the past few days. The price now reaching toward the lower trendline channel on a daily chart.
Stochastic shows on oversold position.
Look for confirmation of price reversal at the support level and combine it with a golden crossover from stochastic which suggest a buying opportunity.
Otherwise the price might continue to fall further.

Waiting for HD to drop to $214 for a bounce playHD reported earning recently and was slightly under eps.
Overall, the materials industry has been taking a beating but we recently got some good news about building permits and home data being up.
plus if they market holds the $310 level and bounces, it will probably take HD with it.
in addition to that, HD has dividend coming up so we can see a dividend run too.


HD at support BUY opportunityHome Depot seems to be entering a solid buy range to rebound off of trend in holiday season.

HD Trend ReversalHD has broken trend and appears to be over valued. Divergence suggested earlier that this move would happen and it has. A move down to a consolidation level would be my guess. I have no positions in this underlying but will get short on a retracement .5 or .618 level if price tries higher.
GL


RSI Divergence in Perspective. Home Depot RSI Divergence.This should not be considered advice. Always do your own research.

$HD looks bullish into earningsP/E ratio 23.9
Yield 2.28%
Company profile
Home Depot, Inc. is a home improvement retailer, which engages in the sale of building materials and home improvement products. Its products include building materials, home improvement products, lawn and garden products, and decor products. It offers home improvement installation services and tool and equipment rental. The company was founded by Bernard Marcus, Arthur M. Blank, Kenneth Gerald Langone and Pat Farrah on June 29, 1978 and is headquartered at Atlanta, GA.

Home Depot may benefit from consumers misfortuneEntry level $238 = Target price $260 = Stop loss $233
Strong momentum in the housing marked.
Strong consumer spending trends.
High rate of refinancing due to lower interest rates, more disposable income to complete home improvements.
Unfortunately HD benefits from extreme weather events and disaster zones like the wild fires in California.
P/E ratio 23.
Yield 2.3%
Company profile
Home Depot, Inc. is a home improvement retailer, which engages in the sale of building materials and home improvement products. Its products include building materials, home improvement products, lawn and garden products, and decor products. It offers home improvement installation services and tool and equipment rental. The company was founded by Bernard Marcus, Arthur M. Blank, Kenneth Gerald Langone and Pat Farrah on June 29, 1978 and is headquartered at Atlanta, GA.

HDOne of my favorite stock in this sector. Forming ascending wedge on weekly. Earnings this week ( Tuesday before open)

Next Week Is Busy for Home Depot and the Housing SectorBelieve it or not, housing is one of the strongest parts of the market in 2019 -- rivaling only semiconductors. Low interest rates and a lack of inventories are helping fuel the move.
The next week is big for the industry, with NAHB's sentiment index, housing starts and existing-home sales all due. Home Depot also reports earnings on Tuesday, followed one day later by Lowe's .
HD broke out to new record levels last August and has formed a tight basing pattern since. The stock has also held its 50-day simple moving average and its stochastics show a bounce potentially starting.


Home Depot shorting soon!Hello everyone, I found a shorting opportunity for HD, bouncing down the channel line. We can short and close in the next days.

HD Bounce Play LongUsing the fibonacci retracement expect HD to bounce at the 0.786 level at about $225. This is a high percentage setup and support has been shown at this level before.

Pattern Double TopThe figure shows the formation of the double top at points A and B. Point C represents the pivot point of support. The change in trend in the breaking of the pattern is clearly observed, before point A is ascending, from point B it is descending and even breaking the support line. Similarly, in the change of trend from point B, a high volume in operations is observed. The data is associated with Home Depot during the month of July of this year.


$DH Home Depot Remains in Bullish ChannelHome Depot looks set to continue from the strong consumer spending environment and the thriving property market. Although the stock is trading at a relatively high 23 P/E ratio, further interest rate cuts could add extra stimulus to the stock.
Average analysts price target $233 | Overweight = expect repricing.
Company profile
Home Depot, Inc. is a home improvement retailer, which engages in the sale of building materials and home improvement products. Its products include building materials, home improvement products, lawn and garden products, and decor products. It offers home improvement installation services and tool and equipment rental. The company was founded by Bernard Marcus, Arthur M. Blank, Kenneth Gerald Langone and Pat Farrah on June 29, 1978 and is headquartered at Atlanta, GA.

Machine Generated Signals. OCT19 WK3 Wkly STOCKS | JNUG & HDMachine Generated Signals. OCT19 WK3 Wkly
STOCKS | JNUG, Long & HD, Long (Expires. Oct 18th)
Become a Free Member | signalclub.io/signals
AMEX:JNUG
NYSE:HD


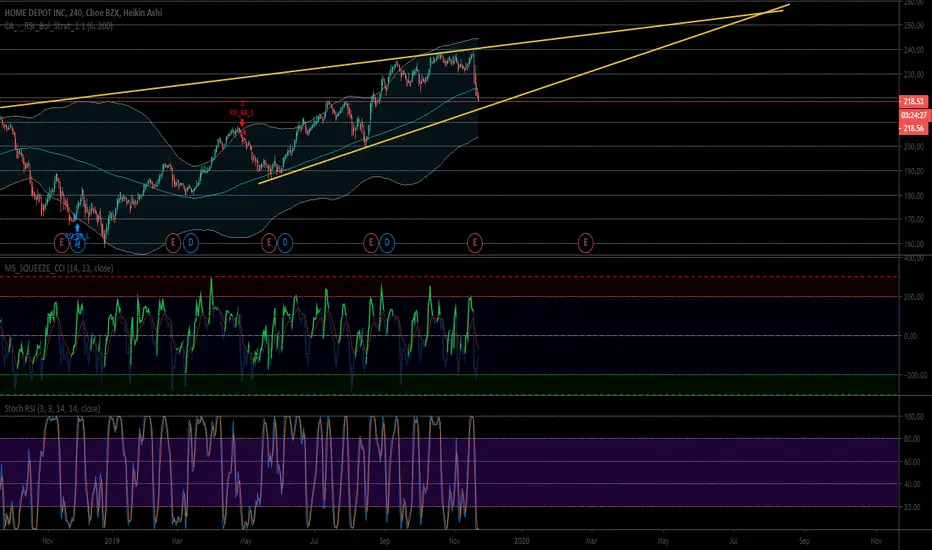
Home Depot downgraded from 'buy' to 'neutral' Home Depot was downgraded ... it's already down about 1.3% pre-market.
Looking at the 4 hour chart, HD has been in an ascending channel since December of last year. It recently bounced off channel resistance, and this downgrade might cause it to fall to channel support.
In addition to the channel, notice that the RSI is overbought. Combine all that with the downgrade, and this might be a good shorting opportunity.
I may purchase a couple put options and ride them down for a week or two.
