HD: Double bottom?Home Depot Inc
Intraday - We look to Buy at 285.03 (stop at 271.38)
Buying pressure from 265.00 resulted in prices rejecting the dip. Posted a Double Bottom formation. The reaction higher is positive and highlights a clear reversal. A weaker opening is expected to challenge bullish resolve. Dip buying offers good risk/reward.
Our profit targets will be 328.98 and 340.00
Resistance: 300.00 / 330.00 / 418.00
Support: 285.00 / 265.00 / 150.
Please be advised that the information presented on TradingView is provided to Vantage (‘Vantage Global Limited’, ‘we’) by a third-party provider (‘Signal Centre’) . Please be reminded that you are solely responsible for the trading decisions on your account. There is a very high degree of risk involved in trading. Any information and/or content is intended entirely for research, educational and informational purposes only and does not constitute investment or consultation advice or investment strategy. The information is not tailored to the investment needs of any specific person and therefore does not involve a consideration of any of the investment objectives, financial situation or needs of any viewer that may receive it. Kindly also note that past performance is not a reliable indicator of future results. Actual results may differ materially from those anticipated in forward-looking or past performance statements. We assume no liability as to the accuracy or completeness of any of the information and/or content provided herein and the Company cannot be held responsible for any omission, mistake nor for any loss or damage including without limitation to any loss of profit which may arise from reliance on any information supplied by Signal Centre.
HD trade ideas

HD making a bearish pushPrice action suggesting a push to the downside, price confirmed a close below the ascending secondary structure along with the 50 day SMA.
The ideal entry, stop and target have been identified on the chart image for your review.

Dead Cat Bounce on Home Depot. HDThat is what it appears like to us at this stage. Overbought on the daily, possibly a result of the ascending pennant (?A Wave) signaling a fair chance of a reversal now to the shown levels. The fact that this is another short idea should not be all surprising given the general pessimism on the markets right now.
We are not in the business of getting every prediction right, no one ever does and that is not the aim of the game. The Fibonacci targets are highlighted in purple with invalidation in red. Confirmation level, where relevant, is a pink dotted, finite line. Fibonacci goals, it is prudent to suggest, are nothing more than mere fractally evident and therefore statistically likely levels that the market will go to. Having said that, the market will always do what it wants and always has a mind of its own. Therefore, none of this is financial advice, so do your own research and rely only on your own analysis. Trading is a true one man sport. Good luck out there and stay safe.

Is HD heading to 250?Looks like HD will hit 250 by end of this week or next week. I understand the hype about Hurricane but the markets are in turmoil and there is no way this heads higher and weekly shows one last draw down before recovering higher.

Hurricanes and Home RepairIt is time to put HD and LOW on your radar for two reasons. One I like how the technical complex looks and the other is the fact a major hurricane is going to rip into Tampa, FL (where I'm at), or somewhere into the U.S.
In that same breadth it is imperative that we keep an eye on the Oil Stocks such as OXY and XOM, of which, I will be looking at and posting shortly with levels.
I will try to link all of those charts together for simplicity purposes.
My support/resistance lines are represented with the horizontal lines. You can use those as targets and/or entries for positions based on bounces of those areas or rejections.

Home DepotI am currently long on Home Depot Options to return back to Supply Zone as we head into a Seasonal Pattern on this particular stock.
We Also have a Double Bottom in play on the 3 Day Chart..

Home Depot to continue the growth trendHorizon: 1-2 months
Target: $350
Technical analysis
The current correction reached more than 90% of the previous movement. Such values are standard within the uptrend and mark its continuation.
Fundamental factor
The Home Depot is an American retailer that is the world's largest retailer of repair tools and building materials. The U.S. Consumer Confidence Index averaged 103.2 points in August compared to 95.7 points in July. This indicates a shift in consumer sentiment toward secondary consumption (including repairs and construction), which may have a positive effect on the company and sales.

HD likely to head lower based on Elliott Wave, Other TechnicalsPrice / Trend
The proper starting point for technical analysis is always price , as many expert technical analysts teach. One major consumer discretionary stock, Home Depot NYSE:HD , has been trending lower since year-end 2021. It has made a decisive series of lower highs and lower lows. A trendline above the highs going back to December 2021 is easily recognized (green line on chart above).
Moving Averages
The 200-day SMA has stopped moving upward and price has cut below it. In the powerful market rally in the major indices ( SP:SPX and NASDAQ:NDX ) over the past two weeks, HD has failed to reach even its 200-day MA. Meanwhile the major indices and many stocks reached or even briefly recovered the 200-day MA.
Other key MAs (not shown for aesthetic purposes) are bearishly stacked and downward sloping on the daily chart including the 50-SMA, 34-EMA, 21-EMA and 8-EMA. Further, the 50-EMA, 34-EMA, 21-EMA and 8-EMA are downward sloping on the weekly chart, which provides an even stronger bearish trend signal.
Elliott Wave
After some time spent mapping out a plausible Elliott Wave scenario—starting at the pandemic lows in March 2020—HD appears in the midst of a corrective move.
First, at the all-time high of 420.61 on December 6, 2021, NYSE:HD completed its 5th wave up from the pandemic lows in the larger degree of trend. The next question is whether the current move downward constitutes an A-B-C correction or the beginning of new longer-term downtrend comprising 5 larger waves. This remains unclear.
But whether the current downtrend is an A-B-C corrective move or the beginning of a longer-term 5-wave impulse move, the pattern has more downside to complete.
Assume the current downtrend is forming an A-B-C correction of the longer-term trend
Assuming conservatively that the current downtrend is forming a corrective A-B-C pattern (a countertrend to the larger uptrend), only the A and B waves have completed. The C wave has just begun.
In an A-B-C corrective pattern, the sub-wave structure is motive (5-waves) within the larger A and C waves and corrective in the B wave. (This is because the sub-waves are impulsive / motive 5-wave moves when moving the same direction as the trend of one larger degree—and here, the trend of one larger degree for the A and C waves is downward, correcting the 5-waves uptrend from the pandemic low.) This is evidenced by the 5-wave structure shown in for the presumed A wave (between December 6, 2021 and February 24, 2022).
Assume the current downtrend is a 5-wave impulsive move starting a new longer-term trend
The current downtrend from the ATH on December 6, 2021 could be the start of a new motive 5-waves downward, having completed Wave 1 (with sub waves 1-5 shown in blue) and Wave 2 (with subwaves shown in purple). If this scenario is accurate, then the next wave that has begun to form would be wave 3, which typically is the longest of the 5 waves. This scenario seems less plausible given the strength shown in the major US indices lately, and the fact that the boats (stocks) tend to follow the tide. However, it's prudent to consider all possibilities, and this remains a plausible scenario.
Fibonacci Projection
Using Fibonacci levels, the first portion of the downward move (from December 6, 2021 to February 24, 2022) can be projected from the March 18, 2022 highs. The 1.00 extension level equals 219.42. At this 1.00 extension level, the two legs of the entire correction would be equivalent in length, a frequent occurrence in highly liquid securities trade on major exchanges. For the next 2-3 months, a reasonable downside price target is first 265 (at the .618 extension) and then 220.00 (the 1.00 extension).
Ideal Trade Trigger
For a bearish position, the setup would be to wait for a bounce to the 21-EMA or 34-EMA on the daily chart. Because HD failed to reach its 200-day SMA on on the recent extraordinary rally in the major indices March 15-29, a retracement to the 200-day SMA is unlikely to occur.
Another option is to wait for HD to retrace to its last swing high on March 29, 2022 at 321.00. If HD remains cannot break that resistance level, then that might provide a good entry for a short with a stop at 321.00.
Momentum
Daily RSI shows momentum never recovered above 57 on the rally from Feb. 24, 2022 to March 18, 2022. RSI then failed at its 8 EMA on this chart and is trending down with a series of lower highs. My other momentum indicator, the Squeeze, shows that volatility is expanding on the current move downward along with negative momentum, which signals that the volatility will increase with downward price movement.

Home Depot Pulls Back After Strong ResultsHome Depot rallied after a strong earnings report last week, and now has pulled back.
The main pattern on today’s chart is the high-volume bullish candle following quarterly results on August 16. The home-improvement chain jumped to its highest level in almost five months, only to stall and drop for five straight days. It then tested a weekly low above $303 before bouncing on Wednesday.
Next, the $303 area is potentially important because it’s slightly above the $298 level that HD has been trying to hold most of the year. (It was originally a low from June 2021.)
Third, TradeStation’s custom script 2 MA Ratio shows how the eight-day day exponential moving average (EMA) has remained above the 21-day EMA despite the recent drop.
Finally, stochastics have fallen into an oversold condition.
TradeStation has, for decades, advanced the trading industry, providing access to stocks, options, futures and cryptocurrencies. See our Overview for more.
Important Information
TradeStation Securities, Inc., TradeStation Crypto, Inc., and TradeStation Technologies, Inc. are each wholly owned subsidiaries of TradeStation Group, Inc., all operating, and providing products and services, under the TradeStation brand and trademark. You Can Trade, Inc. is also a wholly owned subsidiary of TradeStation Group, Inc., operating under its own brand and trademarks. TradeStation Crypto, Inc. offers to self-directed investors and traders cryptocurrency brokerage services. It is neither licensed with the SEC or the CFTC nor is it a Member of NFA. When applying for, or purchasing, accounts, subscriptions, products, and services, it is important that you know which company you will be dealing with. Please click here for further important information explaining what this means.
This content is for informational and educational purposes only. This is not a recommendation regarding any investment or investment strategy. Any opinions expressed herein are those of the author and do not represent the views or opinions of TradeStation or any of its affiliates.
Investing involves risks. Past performance, whether actual or indicated by historical tests of strategies, is no guarantee of future performance or success. There is a possibility that you may sustain a loss equal to or greater than your entire investment regardless of which asset class you trade (equities, options, futures, or digital assets); therefore, you should not invest or risk money that you cannot afford to lose. Before trading any asset class, first read the relevant risk disclosure statements on the Important Documents page, found here: www.tradestation.com .

$HD with a Bullish outlook following its earnings #Stocks The PEAD projected a Bullish outlook for $HD after a Negative over reaction following its earnings release placing the stock in drift C.

$HD building up to retest high's. 🔸️Ticker Symbol: $HD timeframe: 4 Hour 🔸️3X Bull Pattern 🔸️Investment Strategy: Long
TECHNICAL ANALYSIS: $HD looking to retest $332 with new guidance to buy back millions. We are currently on a nice uptrend, as you can see with our regression channel; money momentum is on the way up and our middle band depicts bullish trend. The price retracement to about the 50 is also a clear sign to look for some intraday trades going in to tomorrow's trading session. I will be loading up on some shares in the pre-market tomorrow to see how we react to $332!
We are at a major (but necessary) corrective wave on $AAPL, and I will be loading up positions waiting for a drop back to the lower 160's, potentially lower if price respects Fib retracement.

HD:Bear market rally???Home Depot Inc
Short Term - We look to Buy at 311 (stop at 301)
A bullish reverse Head and Shoulders is forming. This is positive for sentiment and the uptrend has potential to return. Horizontal support is seen at 310. Further upside is expected although we prefer to set longs at our bespoke support levels at 310, resulting in improved risk/reward.
Our profit targets will be 339 and 345
Resistance: 340 / 370 / 420
Support: 310 / 280 / 150
Please be advised that the information presented on TradingView is provided to Vantage (‘Vantage Global Limited’, ‘we’) by a third-party provider (‘Signal Centre’). Please be reminded that you are solely responsible for the trading decisions on your account. There is a very high degree of risk involved in trading. Any information and/or content is intended entirely for research, educational and informational purposes only and does not constitute investment or consultation advice or investment strategy. The information is not tailored to the investment needs of any specific person and therefore does not involve a consideration of any of the investment objectives, financial situation or needs of any viewer that may receive it. Kindly also note that past performance is not a reliable indicator of future results. Actual results may differ materially from those anticipated in forward-looking or past performance statements. We assume no liability as to the accuracy or completeness of any of the information and/or content provided herein and the Company cannot be held responsible for any omission, mistake nor for any loss or damage including without limitation to any loss of profit which may arise from reliance on any information supplied by Signal Centre.

$HD Supply zone!!What we need to watch the $318.44 / $321.24 resistance number one if we can break above then we are going for 340 lvls. Watch for pullback to support lvls for entries on calls


HD The Home Depot Options Ahead Of EarningsLooking at the HD The Home Depot options chain, i would buy the $300 strike price Puts with
2022-8-19 expiration date for about
$2.80 premium.
Looking forward to read your opinion about it.

$HD CALLS SOON - Looking for the break above 310.51 then will look to scale into calls...
- 318 will be the first target
- If we can get above 318 we have a long way to keep on going

HD approaching overhead resistanceHD testing a known area of resistance at the TEAL structure above.
A settlement below the BLACK channel could offer a short opportunity.
This one will remain active on my watchlist.

Home Depot Tries to Break Out Before Housing DataHome Depot could be attempting a breakout as investors await key industry data.
The main patterns on today’s chart are the falling trendline and the 50-day simple moving average (SMA). HD is attempting to push through both.
This is especially interesting because TradeStation data shows fewer than one-third of S&P 500 companies are above their 50-day SMAs. The fact HD remains above it shows the stock has spent more time bottoming than the broader market.
Next, MACD has been made higher lows for months as the stock made new lows. That’s a potential case of bullish divergence.
The 8-day exponential moving average (EMA) is also above the 21-day EMA.
Next, consider how the DIY giant has reacted to quarterly results this year. It tanked in February despite beating estimates. It tried to rally on strong numbers in May, but couldn’t get above the 50-day SMA. Such weakness isn’t a surprise considering market sentiment toward interest rates. But with that worry fading in the past month, will price react differently in the second half?
Traders could find out as early as this week, which features NAHB’s housing market index on Monday and housing starts/building permits on Tuesday. HD’s next quarterly results are due August 16.
TradeStation has, for decades, advanced the trading industry, providing access to stocks, options, futures and cryptocurrencies. See our Overview for more.
Important Information
TradeStation Securities, Inc., TradeStation Crypto, Inc., and TradeStation Technologies, Inc. are each wholly owned subsidiaries of TradeStation Group, Inc., all operating, and providing products and services, under the TradeStation brand and trademark. You Can Trade, Inc. is also a wholly owned subsidiary of TradeStation Group, Inc., operating under its own brand and trademarks. TradeStation Crypto, Inc. offers to self-directed investors and traders cryptocurrency brokerage services. It is neither licensed with the SEC or the CFTC nor is it a Member of NFA. When applying for, or purchasing, accounts, subscriptions, products, and services, it is important that you know which company you will be dealing with. Please click here for further important information explaining what this means.
This content is for informational and educational purposes only. This is not a recommendation regarding any investment or investment strategy. Any opinions expressed herein are those of the author and do not represent the views or opinions of TradeStation or any of its affiliates.
Investing involves risks. Past performance, whether actual or indicated by historical tests of strategies, is no guarantee of future performance or success. There is a possibility that you may sustain a loss equal to or greater than your entire investment regardless of which asset class you trade (equities, options, futures, or digital assets); therefore, you should not invest or risk money that you cannot afford to lose. Before trading any asset class, first read the relevant risk disclosure statements on the Important Documents page, found here: www.tradestation.com .

HD SELLHD in an established downtrend, overbought on several charts on various indicators. We haven't even seen weakness in housing, job losses, consumer cutting back HD has a long way to fall. Bought 26 Jul 29th $285 puts will add every $1.00-$1.25 increase in stock price, first pit stop is $250 range

Puts on HDThe trendline is providing resistance and low volume on the last reaction high is signaling a further downtrend.

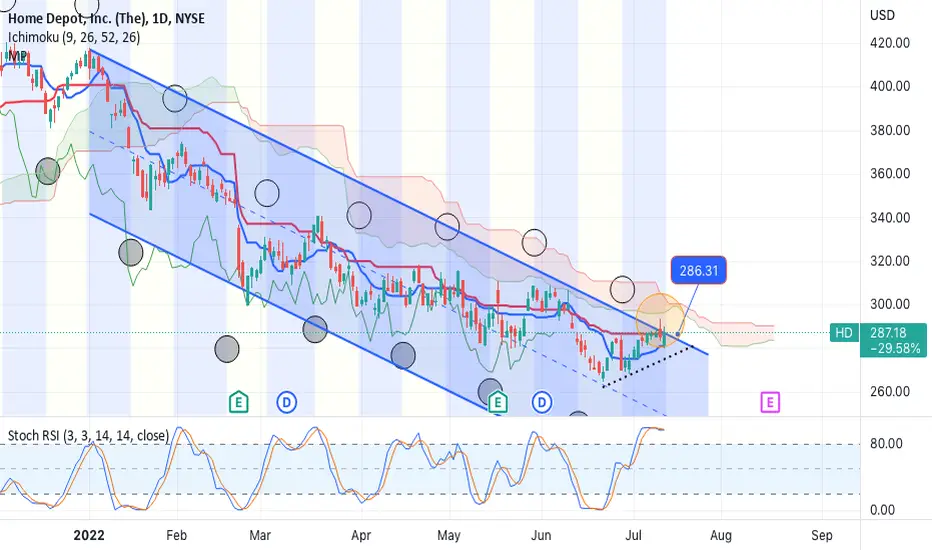
HD-SELL strategyWe are at a cross road at the top of the channel. Normally it may suggest we will break through it, but in this case we got a negative daily stochastic suggesting we should see lower prices in the near term.
The strategy is therefore, SELL @ 285-288 and take profit @ 257 for now.
HD testing resistance above this weekHD actively testing and failing from its attempt to overcome resistance above.
HD in past weeks has held steady at support below.
Support and Resistance channel structures have been adjusted for your review.

