HIMS - Wait for it, don't rush itI would wait for the correction to complete around the 45 zone, then start adding when the parallel channel breaks. It has already faked out once. Do not fall for this.
HIMS trade ideas

Where is HIMS set to go next?Overview of Hims & Hers Health (NYSE: HIMS):
Pros
Expanding into weight-loss treatments
-Hims successfully entered the high-demand GLP‑1 weight-loss space by selling compounded semaglutide during shortages. With branded Wegovy now available on their platform in partnership with Novo Nordisk, they’ve broadened their offering.
Solid growth & rising profitability
-Revenue surged ~18% in 2024 to $1.78 b ttm, with annual net income of $164 m.
-Q1 2025 reported >100% YoY revenue growth ($586 m) with expected profit of 20¢/share.
Strong gross margins
-At around 80–88%, comparable to peer telehealth platforms.
Diverse healthcare offerings
-Beyond weight loss: sexual health, skincare, hair loss, mental health via DTC model. Expanded further via European acquisition of ZAVA (~1.3 m subscribers).
Undervalued relative to future earnings
-Analysts project 2030 revenues of $6.5 b—implying mid‑20s% CAGR. With projected EPS ~$1.5 b, current multiples (P/E ~40x) might look reasonable long term.
Cons
GLP‑1 strategy under pressure
-The end of compounding allowances by FDA reduced their low-cost advantage.
-Dependence on cash-pay vs. insurer coverage may limit growth if insurers cap co-pays.
High valuation with risk
-Trading at ~84x trailing EPS and ~70x forward EPS—wide margin for missteps.
-Analysts average target at $38 (≈ 33% downside), 12 rate it a 'Hold'.
Competitive & regulatory headwinds
-Market crowded with telehealth players like Ro, Noom, CVS, and insurers which may undercut cash-pay model.
-Legal scrutiny over “personalized” compounded products persists; Novo lawsuits underway.
Reputation & controversy
-CEO’s political donation stirred backlash; regulatory scrutiny around ads and compounding practices.
-Platform has faced occasional service and customer trust issues.
-Disclaimer: This analysis is for informational and educational purposes only and does not constitute financial advice, investment recommendation, or an offer to buy or sell any securities. Stock prices, valuations, and performance metrics are subject to change and may be outdated. Always conduct your own due diligence and consult with a licensed financial advisor before making investment decisions. The information presented may contain inaccuracies and should not be solely relied upon for financial decisions. I am not personally liable for your own losses, this is not financial advise.

$HIMS | Direction: Long | Key Reason: Macro | (June 19, 2025) NYSE:HIMS | Direction: Long | Key Reason: Macro & Technical | (June 19, 2025)
1️⃣ Insight Summary
We’re watching for a healthy pullback into the $31–$30.10 zone on NYSE:HIMS before entering. That drop should align with both fundamental value and technical support, setting the stage for a strong bounce.
2️⃣ Trade Parameters
Bias: Long
Entry: Around $31.00–$30.10
Stop Loss: Below $21.00, with a hard stop at $19.00 if price breaks structure
Take Profit 1: $44.00
Take Profit 2: $59.71
3️⃣ Key Notes
✅ Fundamentals are solid: Revenue ~1.48B, net income ~200M, market cap ~113B. 2024 marked the first profitable year. Debt sits @ $11M, while free cash flow is ~$1.098B—low debt relative to cash flow.
✅ Ratings & margins: ~14% free cash margin, realistic forward estimates, stable beta (~3.2) and 0.15 EPS.
✅ Risk/Reward profile: Entry gives ~10–11 points of downside vs. ~13–29 points upside to targets.
✅ Technical scenario: A pullback to $30–31 acting as support would confirm our bias—monitor price action closely in this zone.
✅ Sector tailwinds: Continued momentum in telehealth, mental health, and AI-driven medical services supports upside potential.
4️⃣ Follow‑up Note
If NYSE:HIMS drops into our entry zone and shows a solid bounce or structure retest, we’ll confirm the long setup. From there, our targets at $44 and $59.71 come into clearer focus.
Please LIKE 👍, FOLLOW ✅, SHARE 🙌 and COMMENT ✍ if you enjoy this idea! Also share your ideas and charts in the comments section below! This is best way to keep it relevant, support us, keep the content here free and allow the idea to reach as many people as possible.
Disclaimer: This is not financial advice. Always conduct your own research. This content may include enhancements made using AI.

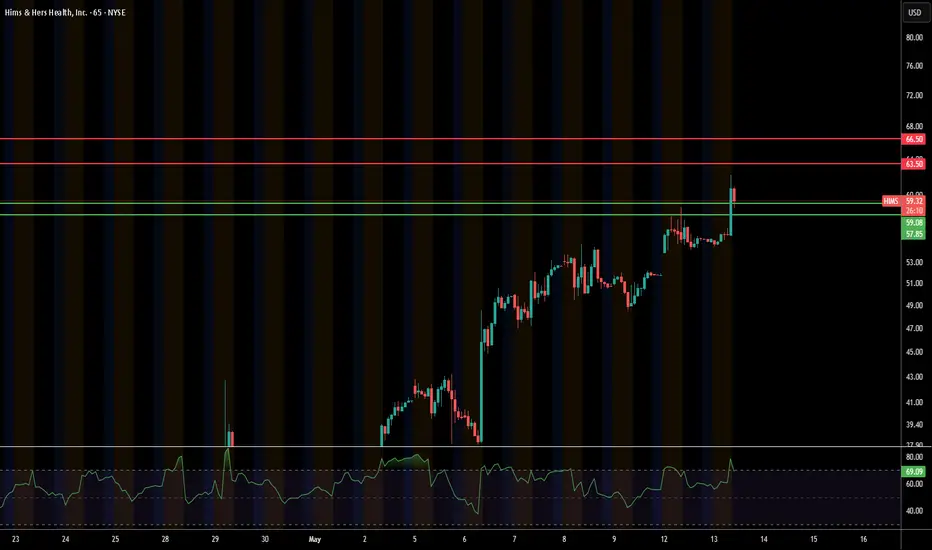
HIMS- possible breakout as stock held 21 EMAHIMS - Stock after massive uptrend last month. stock has been consolidating and holding above 21 EMA support level. looking for more upside above $58 for a move towards $65 and $78, calls above $58 and $60 looking good. Stock is decent at indicators

HIM $39?Company has been doing great but failed to break the $67 resistance.I see a FVG just stopping at the order block for $39. Seems like a good rebound to capitalize. I do not see this company going down unless is a really short bounce to cover inbalances.

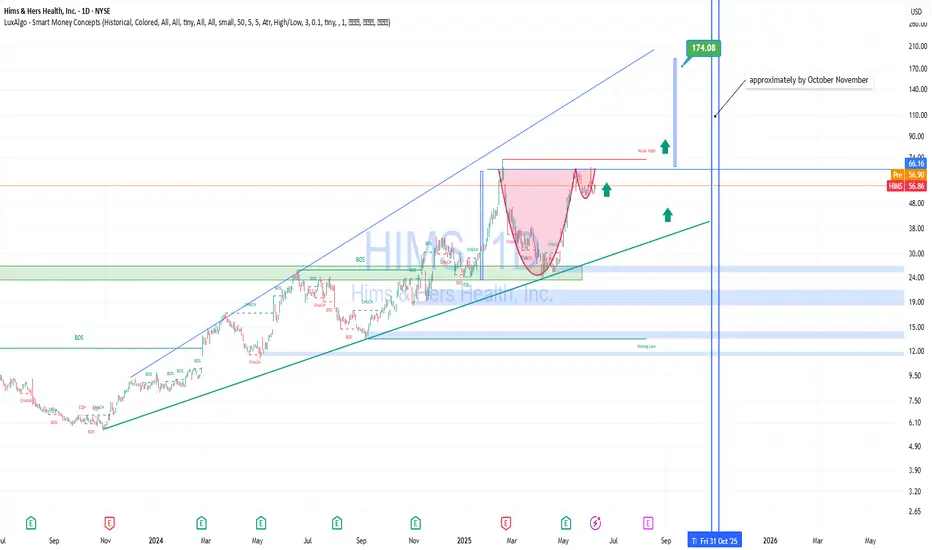
HIMS – Technically and Fundamentally Strong for Mid-to-Long TermTechnical Analysis
HIMS is trading in a clear ascending channel since 2023.
On the daily chart, a “cup and handle” formation has completed, with a confirmed breakout above the neckline ($55–$57 area).
The price is consolidating near the breakout point – classic behavior before a continuation move.
Target projection from the cup pattern is $170+, implying a 200%+ upside potential.
The stock also respects the upper trendline of the long-term channel, reinforcing bullish structure.
Fundamental Strength:
Telemedicine megatrend: Digital health is booming. HIMS is one of the few well-established D2C players in the U.S. market.
Revenue growth: Annual revenue growth exceeds 40% YoY, a sign of operational efficiency and demand.
Sticky subscription model: Over 1.5 million active subscribers — solid base for recurring revenue and LTV.
Valuation upside: Still undervalued relative to sector peers despite recent rally.
Scalable tech stack: Strong backend, customer acquisition systems, and vertically integrated infrastructure support further expansion.
Conclusion: HIMS offers an attractive risk–reward setup for swing traders and long-term investors alike
HIMS – Long Setup | Potential 60% MoveHims & Hers (HIMS) just gave us a textbook Ichimoku breakout and is holding strong above the cloud after a healthy pullback.
Technical Breakdown:
Price above Kumo Cloud: Bullish structure intact.
Support held at $54.62 – key base above cloud and Tenkan-sen.
MACD is curling back after a corrective wave, showing early signs of momentum returning.
Risk/Reward: 8.59 – Extremely favorable.
Target: $93.58 (60.22% upside)
Stop: $51.78 (7.01% downside)
Rationale:
HIMS continues to ride bullish sentiment in the healthcare and telemedicine sectors. This chart has a clean continuation setup with institutional buy zones likely around $54-$55. Risk is tightly controlled, and upside potential is significant.

$HIMS setting up for its next big move—here’s what I’m watching!🔥 NYSE:HIMS setting up for its next big move—here’s what I’m watching! 🔥
📉 Eyeing momentum down to $44-$48, and I’m not mad about it!
🔄 That flip from resistance to support is key for long-term price growth.
🚀 Bull flag breakout could come sooner—stay locked in! Keeping an eye on it all for the next trade entry on this beast!
💬 What’s your take? Are we bouncing or breaking out? Drop your thoughts below! ⬇️

Quick View: $HIMS- Bullish crossover on the hourly chart with low-volume pullback.
- Bullish daily chart
Area of $58-$59 as key resistance.
Support → $50

HIMS Weekly Options Outlook — June 3, 2025📉 HIMS Weekly Options Outlook — June 3, 2025
🚨 AI Model Consensus: Moderately Bearish into June 6 Expiry
🧠 Model Overview
🔹 Grok (xAI)
Bias: Neutral
Setup: Bearish short-term, bullish long-term; mixed outlook
Trade: No action — lacks edge
Confidence: 35%
🔹 Claude (Anthropic)
Bias: Moderately Bearish
Setup: Below EMAs, bearish MACD; cautious sentiment
Trade: Buy $52P @ $0.94 → PT $1.88+, SL $0.56
Confidence: 72%
🔹 Llama (Meta)
Bias: Moderately Bearish
Setup: Post-run fractal pullback, mixed but leaning down
Trade: Buy $52P → PT +20%, SL −50%
Confidence: 70%
🔹 Gemini (Google)
Bias: Moderately Bearish
Setup: Clean break under EMAs, MACD/RSI confirm weakness
Trade: Buy $50P @ ~$0.47 → PT 100%, SL 50%
Confidence: 65%
🔹 DeepSeek
Bias: Moderately Bearish
Setup: Breakdown across timeframes; skewed put flow
Trade: Buy $50P @ $0.45 → PT $0.70, SL $0.32
Confidence: 65%
✅ Consensus Summary
📉 4 of 5 models recommend bearish weekly puts
🔻 Clear breakdown under EMAs with supportive MACD/RSI signals
🧲 Max Pain at $55 could cause late-week pullback or stall
🎯 Preferred strategy: OTM naked puts with high ROI potential
🎯 Recommended Trade Setup
💡 Strategy: Weekly Bearish Put Play
🔘 Ticker: HIMS
📉 Direction: PUT
🎯 Strike: $52
💵 Entry: $0.94 (ask)
🎯 Profit Target: $1.70 (+80%)
🛑 Stop Loss: $0.56 (−40%)
📏 Size: 1 contract
📅 Expiry: 2025-06-06
⏰ Entry Timing: Market Open
📈 Confidence: 70%
⚠️ Risk Factors to Watch
🧲 Max pain at $55 could slow breakdown or cause snapback
🔻 $52 support zone may cause consolidation or chop
📉 Falling VIX = compressed premiums, slower option movement
⌛ Theta accelerates into Thursday/Friday — exit early if flat

HIMS 1D — This pattern didn’t cook for nothingOn the daily chart of Hims & Hers Health, we’re looking at a textbook cup with handle formation — not just a pattern, but a structure backed by time, volume, and classic price behavior. The base of the cup formed steadily from February to May 2025, and as soon as the curve was complete, price transitioned into a tight consolidation — the "handle" that often masks real accumulation.
Right now, price is testing the resistance area. And it’s not just floating up there — it’s coming in hot: price has already broken through EMA 20/50/100/200 and SMA 50/200. That’s a full stack flip. This isn’t sideways noise — it’s a structural shift in control.
Volume is starting to build as price rises, confirming that demand is real and institutional positioning likely active. We’re watching a breakout zone above the handle — and when that breaks, the structure unlocks with a clear target: $107.25, roughly a 2x move from current levels.
This setup isn’t noise. It’s a long-cooked formation that’s now about to boil over. If the handle holds and price breaks through — the rest is just follow-through.

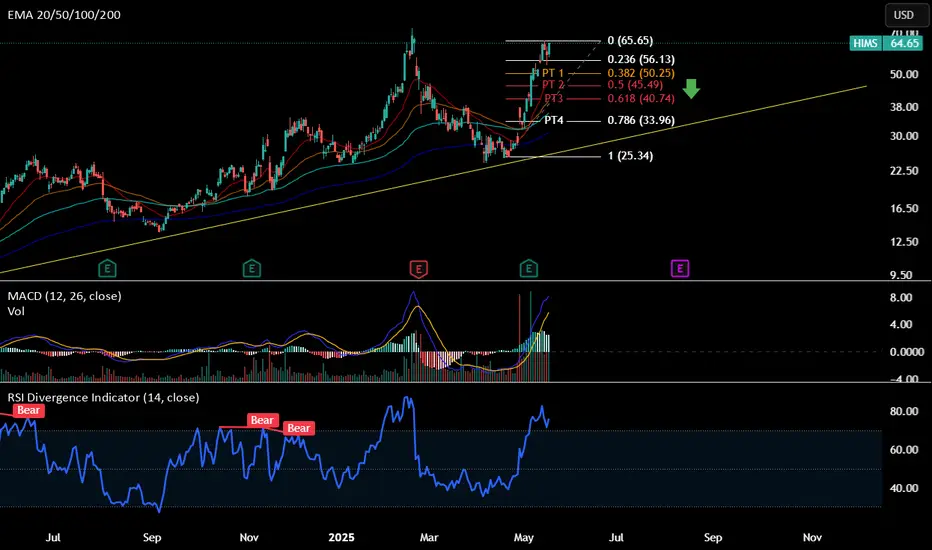
Short - HIMSLong-term trend line: Rising trend line -> short-term bearish due to expected trend line retest (yellow trend line)
Daily MACD & RSI : Overbought -> expect a pull back
Support Line to enter PUT: ~$54
Expected time zone for pullback: 30 days to 50 days
PT1: ~50.25
PT2: ~45.49
PT3: ~40.74
PT4: ~34.96
Possible PT5: expect to cross down the EMA 200 at ~$27, which is close to the trendline support. However, I'll exit all play at PT4.
HIMS Corrective Wave PullbackLooks like HIMS started its corrective wave pull back. The MACD is about to cross the signal to finish wave B, it most likely will close the gap above. Then I expect it to pull back to around the .5 & .618 fib around $40-45 range where I also there is confluence with the AVWAP from the April 7 pivot around $45. I plan to add in this range before the next leg up.

Safe Entry Zone HIMSAfter reaching the Target with 150% profit.
Now the Blue Zone IC Zone(Interesting Zone or Institutional Candles Zone) is most appealing support level where we wait for Potentional of Strong Buyers to Step In.
Note: Potentional of Strong Buying Zone:
We have two scenarios must happen at The Mentioned Zone:
Scenarios One: strong buying volume with reversal Candle.
Scenarios Two: Fake Break-Out of The Buying Zone.
Both indicate buyers stepping in strongly. NEVER Join in unless one showed up.
Take Care.

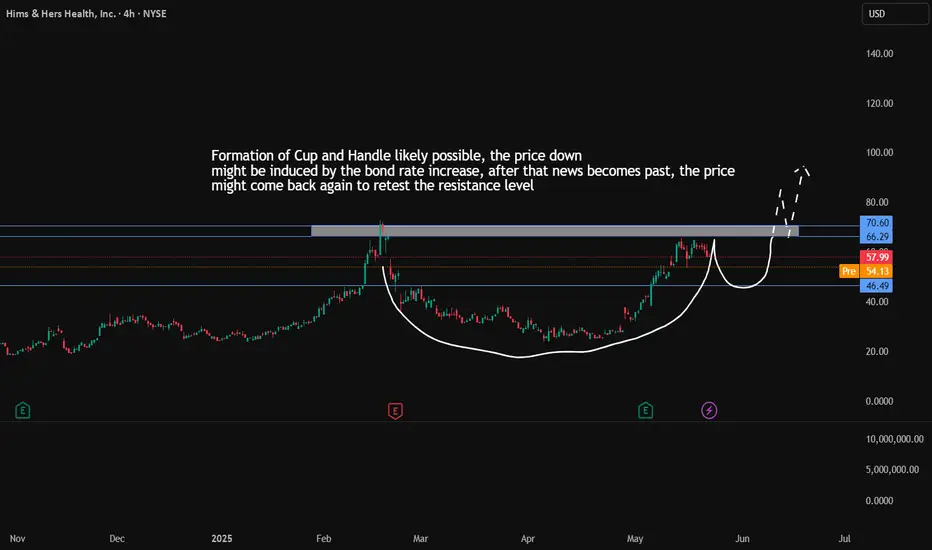
HIMS cup and handle possible.These price actions can occur in NYSE:HIMS in coming days:
- CUP and HANDLE
- Resistance of $66 level can be broken with volume
- Retracement at FIB 0.5 of price $53.6 is less likely, but possible
- Retracement at the resistance level after a break would be good zone for some action
Fundamentals:
- Revenue and net income has increased massively compared to Q1 '24 of Q1 '25.
Safe and Confident Entry ZoneStock reached resistance and rejected with fake break-out.
The stock targeting the green 4h zone.
Note: Potentional of Strong Buying Zone:
We have two scenarios must happen at The Mentioned Zone:
Scenarios One: strong buying volume with reversal Candle.
Scenarios Two: Fake Break-Out of The Buying Zone.
Both indicate buyers stepping in strongly. NEVER Join in unless one showed up.
Take Care.

Hims is OVERBOUGHT Market Context ✨
NYSE:HIMS | Current Price: $42.00
1-Month Move: +17.5% (from $35.75)
1-Year Move: +68.2% (from $25.00)
Year High/Low: $43.50/$24.80
Technicals
RSI: ~75.8 (overbought )
Moving Averages: Above 20-day, 50-day, and 200-day MAs (strong uptrend, but overextended )
MACD: Bearish divergence forming (momentum fading, potential reversal )
Trade Setup
Direction: PUT
Entry Price: $42.00
Take Profit 1 (TP1): $36.00 (~14.3% gain )
Take Profit 2 (TP2): $30.00 (~28.6% gain )
Expected Move: ~12–15% downward
Best AI Signals on the market

$HIMS ONCE IN A LIFETIME FIBONACCI HARMONICNYSE:HIMS ONCE IN A LIFETIME FIBONACCI HARMONIC The 618 29.56 ENTRY was SPOT ON!
It's NOT DONE yet we are gave yall a NICE 10% POP on FRIDAY
Looking for the next dip buy setup here before ALL TIME HIGHS
Will alert here no charge drop a LIKE for me LETS GO

Hims set to correctHims is pulling yet another amazing short squeeze. The stock has become my largest position by far since I got in back around 7$. These supply and demand zones have been drawn for a while. Note the amazing consolidation and push from the green demand box. 73$ would be double top mode. While I love the fundamentals I am not sure if the stock sis worth 70$ until we see next earnings which shouldn't be amazing because of their stated margin decreases, the market will panic like it always does. I would LOVE a retest of 35$, but 45$ is more likely.

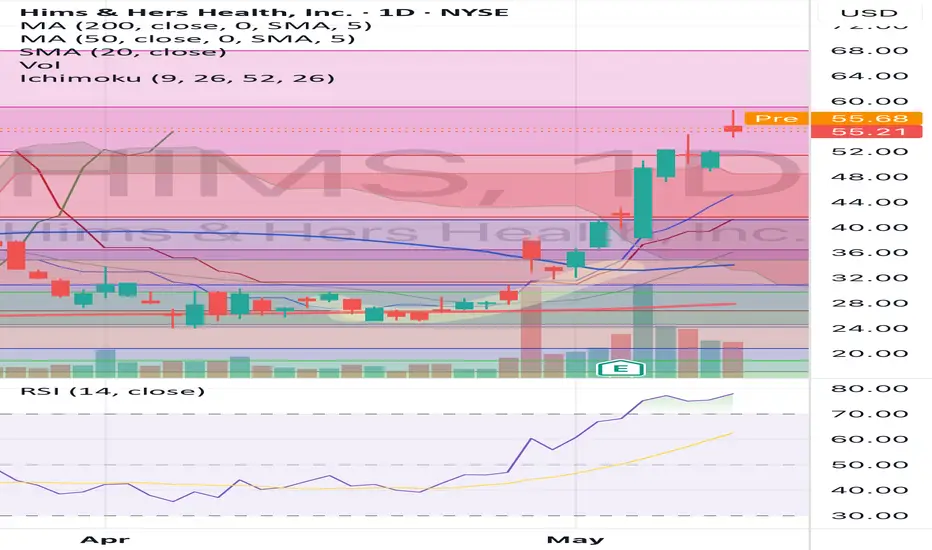
HIMS – Pullback Opportunity After Massive RunHIMS has been one of the hottest stocks in the market recently, with a massive run fueled by strong earnings. But now we’re seeing the first meaningful pullback — and this could be a golden opportunity:
🔹 Earnings Gap Reversal (Bullish Signal)
Despite an earnings gap down, buyers stepped in aggressively, pushing the stock higher.
This is a classic earnings gap down reversal — a strong sign of demand.
🔹 First Pullback Opportunity
Historically, the first pullback after a major run tends to get bought.
I’m watching two key levels for a potential buy:
The shaded zone between the 9 EMA and 20 EMA (dynamic support).
The 0.38 - 0.50 Fibonacci retracement for added confirmation.
🔹 My Trading Plan:
1️⃣ Initial Entry: Starter position in the shaded EMA zone (9 EMA - 20 EMA).
2️⃣ Confirmation Add: If price bounces off the Fib zone (0.38 - 0.50) with strength.
3️⃣ Stop Loss: Below the 20 EMA for any initial position — keeping risk tight.
🔹 Why This Setup is Compelling:
Strong run + earnings reversal shows real buyer interest.
First pullback after a big run is typically a strong buying opportunity.
The dual confluence of EMAs + Fibonacci enhances this setup.
⚠️ Risk Management: Tight stop below 20 EMA — always control risk.

HIMS backtest of level for callsHIMS way oversold on daily and 4hr chart. retest and hold of $61 is good spot for calls to cool RSI off and a move up to $65

trend seems obviousHims retesting lower level and looking higher. Once at top of range i will sell some covered calls to lock in some profit. I'm up more than 100% on my trade at this point, if you follow me you know.
AbidingFrom previously drawn fibs, we see price action abiding to support and resistance levels. As it breaks out of the low range it tests $41 level. Textbook breakthrough resistance