Profit booking can come around 770 levelsINFY seems to be forming long term top here.
Around 770 levels one short with stop loss 820 target 600 minus
This is not short term call.Take position as per your comfort
INFY/N trade ideas

INFY - UPDATED LEVELS /Analysis Infy closes above the 730 levels, that it had been resisting from past many weeks with a big Bull candle that opens near its low and closes near its high with huge volume.
Higher high , high low Structure of the stock is maintained , hence any dip in the stock might get absorbed.
There will be many who missed the move and would like to enter in the stock, but buying a stock at any levels is not a good idea, so we have to keep our levels ready and wait for the stock to test it, though it requires patience and you might feel you will miss the move... but trust me patience always pays you well.
My mantra for flawless entry :-
Keep the levels ready
Have Patience
Pull the trigger at right time
Now as per my analysis 700 -685 is going to be good support.
Stop will be same at 650 levels.


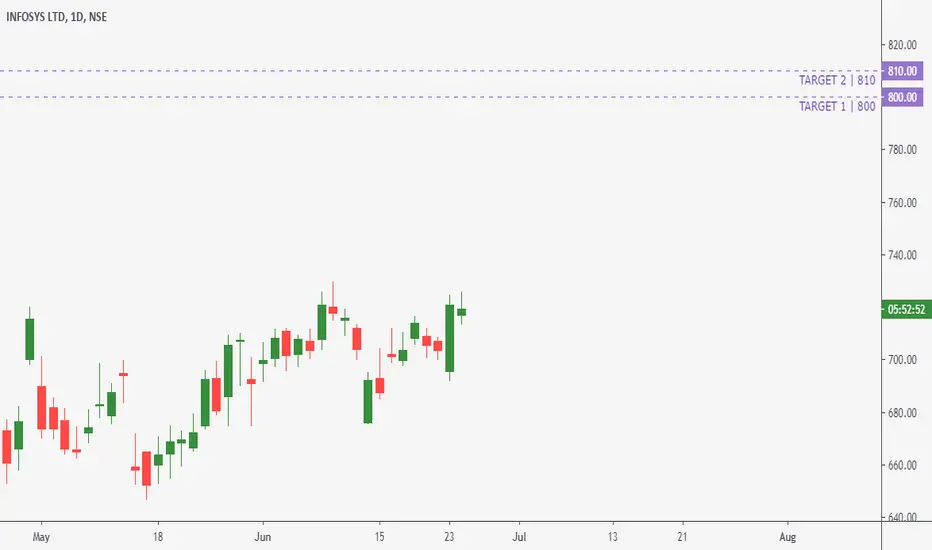
Buy Infosys | Expected Profit 15-16%Goodluck Capital Recommendation
Buy Infosys Ltd
(NSE: INFOSYS)
Buy Range - 685-710
Target - 800-810
Potential Return^ 15-16%
Once 1st target hit, reset StopLoss at 760
^ Potential returns are calculated based on the median of buy range.
INFY - RESISTING AND RESISTING AT 730715- 730 turn out to be a solid resistance for the stock , stock is resisting this zone from past many weeks.
I am not bearish on the stock , as long as it trading trading above 650 levels.
So watch this zone , or set an alert to keep this stock on radar.
Because breakout can trigger a good good rally in the stock.

INFY - GO SHORT @ 735 FOR A RR OF 1:6 BY JULY ENDINFY - GO SHORT @ 735 WITH A SL OF 760 AND A TARGET OF 600. TARGET SHOULD BE ACHIEVED BY END OF JULY

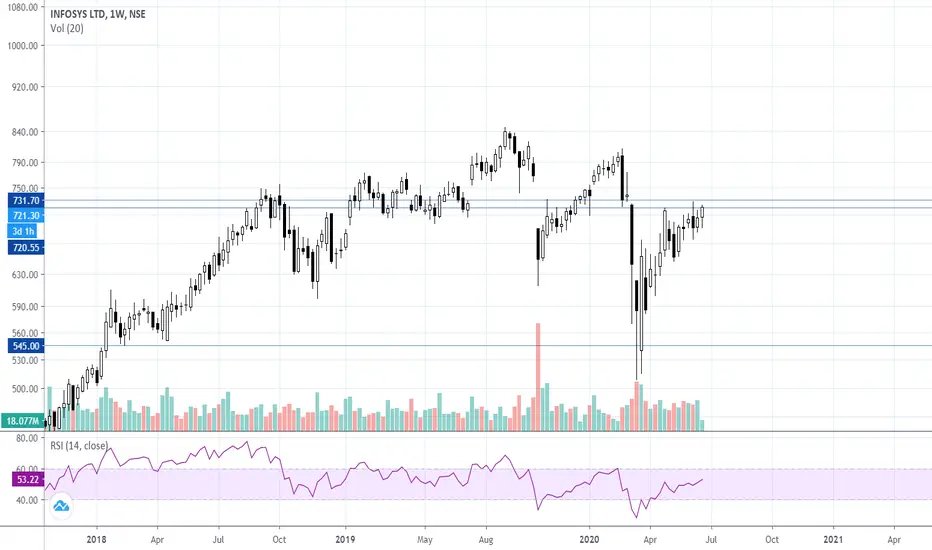
INFY Stock Price and Chart AnalysisInfy is currently trading at 721 levels, and has entered a weekly resistance zone of 720 -730 levels.
The stock was not able to past through the zone from past 8 weeks.
If the stock closes above this on weekly basis , which will open up new levels on the upside , and the immediate levels are 780 and 840 .
Major support for the stock stands at 650 levels.
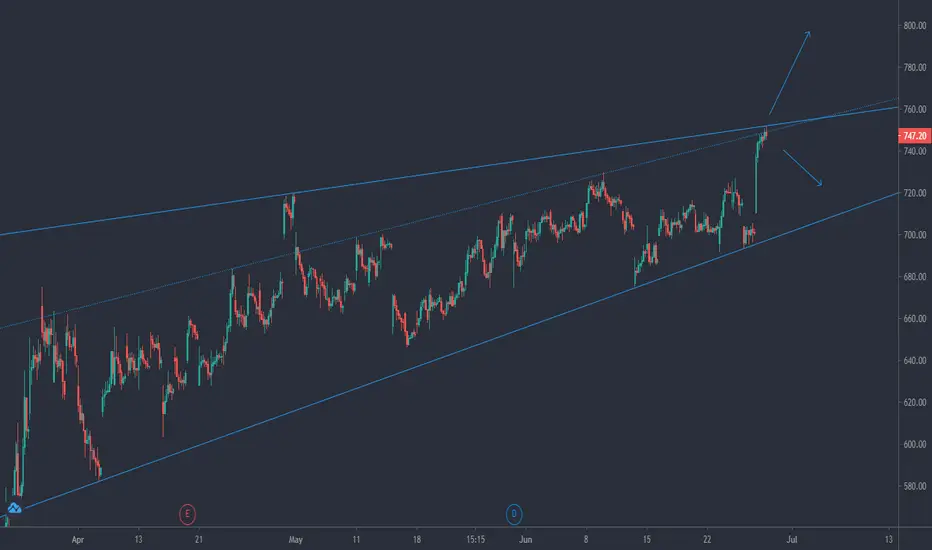
Infy.... Uptrend continuation .. ??Observations : Rallied from 676 levels to 720 levels....
Currently in pullback mode....
boince back zone... 690-685 levels,,,, more bull power only above 721... closing basis...
View Negates below 663 levels,,,,,,


infy - error in figs vis-a vis candle closingINFY - First 15 Min candle closed around 695.70... why the numeric numbers OHLC highlighted in yellow....! shows Close as 700 something...? Why this.


Infosys 15 Minutes Chart Close Give Below 701.30 Than Big MomentInfosys ( INFY)15 Minutes Chart Close Give Below 701.30 Than Big Moment Expect To Down Side

Infosys - Nearing the important Resistance level720 has been a big resistance for this stock. A move higher is possible only on closing above 720 levels.


INFY - GO SHORT @ 735 FOR A RR OF 1:6 BY MID-JULYINFY - GO SHORT @ 735 WITH A SL OF 760 AND A TARGET OF 600. TARGET SHOULD BE ACHIEVED BY MID-JULY

Add #INFOSYS in your Watch listLook at Infosys Daily chart. It looks beautiful on TA. Recently it broke the resistance level, but again its trading under those levels. Also the short term trendline is supporting the stock. Once it breaks the short term trendline, it can rally further downside. Need to closely watch the stock.
0% luck, and 100% SKill are required to become a good trader. You need to need get a proper trading plan.
Few Takeways to become a good trader:
1. Never risk more than 1% of your capital
2. Before entering a trade you should know your Stoploss levels and Exit levels.
3. Dont be Greedy.
4. Trade in stock market like a business and not like gambling.
5. Train your mind to become a trader. Risk only that much which doesnt effects your daily life

INFY - Long Term/Medium/Short ViewFor me its a buy on dip stock for positional trading as long as its holding 650 levels on the downside.
Stock has been facing resistance around 715-720 levels from past one month but is able to sustain 695 - 700 levels from past 10 sessions.
Hence holding 690 levels can lead stock to 770+ levels on the upside.
Trend of the stock is on upside on all time-frames , thus following are the levels that should be watched.
Short term support 690
Medium term support 650
Long Term support 460- 500


