Bullish Flag. Watch for breakout. Tgts: $70, $75Greetings Investors and Traders,
I'm bullish JMIA based on the following:
Bullish Factors
1. Bullish flag pattern formed on the daily chart. Watch for a channel breakout, with volume confirming the move. If valid, target resistance around $70.
2. Rounding top formed pattern formed on the daily chart.
Strategy
1. Consider the 16 Apr $60C, $65C, or $70C.
Happy Trading!
Disclaimer. My ideas are for informational purposes only. My ideas do not constitute solicitation, recommendation, endorsement, or offer to buy or sell any securities or other financial instruments. You should not construe any such information or other comments as legal, tax, investment, financial, or other advice. There are risks associated with investing in securities. Investing in stocks, bonds, exchange traded funds, mutual funds, options and money market funds involve risk of loss. Loss of principal is possible. Please exercise your own due diligence.
JMIA/N trade ideas

JMIA: Nearing Cycle Completion quickPost:
NYSE:JMIA
JMIA may be reaching completion of its recent impulse movement. Just took a quick look so this one may need some polishing

JMIA LongJMIA 2-4 Week Horizon
Price is trading at 21ema area and seems to be holding. Stochastics is at an oversold level ready for a bullish move. Price seems to be about ending wave 4 and by theory should reverse around the 38.2% Fibonacci level. As long as 54.15 support holds we could see a move up in price and a possible wave 5.
MACD lines pointing down and histogram shows strong red momentum. Price could range around buy zone for a bit, but as long as support holds, we should be good.
Disclaimer
I am not a registered investment professional. These are just my opinion and not an investment advise or recommendation. For entertainment purposes only.


JMIA H&S completion into leg 5Please check $JMIA H&S Completion that goes into the start of possible IMPULSE leg 5 of Elliot Wave

$JMIA Descending into Earnings 2/19-2/24Video breakdown on $JMIA going into Earnings!Short term Short, Long term long

Jumia down turnWe are in a down turn on jumia. But that's just where it seems it's going. There is a lot of other issues going on in the broader markets.

JMIA Forming New Support for BreakoutJMIA is currently testing its previous trendline as support( green line ).
The candle pattern and standard deviation pertaining to strength of move in relation to volume, indicates that a base has been formed above the previous resistance. If the price action is able to break the current resistance( blue line ) formed within the move above the previous trendline( green line ), it should test the next overhead resistance along the upper trendline( orange line ). The projected strength of this move ( based off prior moves showing similar indications ) shows the potential to reach the upper trendline resistance( orange line ) within the next few weeks with a pullback expected once the price reaches near $79 . If the move maintains demand within the market, the price action could see $85.50-$87.75 once the trendline resistance ( orange line ) is confirmed as a support.
A break below the current trendline support ( green line ), followed by a rejection of re-entry, shows a probable move to test support of the previous trendline( red line ). This is unless it is able to form its own support from and increase in demand above previous levels of buyers entering the market. In my opinion since the $53-$55 demand has already been tested as support, the earliest this demand-formed support could develop above the previous trendline( red line ) would be between $49-$51 ($51 support level would indicate strength with it being a 1.13 extension of the previous retracement). The lowest a support should be formed to continue an uptrend would be between $46-$47 . This would require that the price had broken down below the previous trendline support( red line ) and successfully regained entry from the support. This move would be similar to the trend re-confirmation that happened on 06 Jan 21.
The potential long entries for this trade:
Similar to the move described above, entry could be after a break below the green line and a strong re-entry into the current price range. This would indicate a demand based confirmation of the upper trend.
OR
Entry can be when the price has confirmed support above the demand indicated candle( above the dashed red line ).
The indicated potential stop loss would not necessarily be within that range, but within that range after a rejection of re-entry into above trend( green line ). Although, waiting for a retest of the green trendline would increase risk as there is no guarantee it will find the demand to retest this resistance.
**This is not financial advice or a suggestion to enter a trade in JMIA, this is just what I am looking for in my own personal entry.


JMIA: Nice set up for ABC correction* Stock is up 1100% this year.
* It's trading at 27 times sales (not earnings)
* Average price target is $28 and is trading above the high estimate of $61 (low of $9.50)
* it isn't run by Elon Musk.
$38 price is still generous, but like John Maynard Keynes said, “the markets can remain irrational longer than you can remain solvent.”
JMIA - Short Play during an uptrend IdeaFor my autistic friend who wants to go short in a higher low and higher high trend.

parabolic breakout continuescongrats to JMIA longs, top trendline is now acting as support :) diamond hands are really paying off here, 100 is right around the corner, stay strong! lets keep eating, goodluck as always <3

A 20 fold returns in just 12 months AH.......HOW CAN I MISSED THIS GREAT OPPORTUNITY ?
I better get in fast before the train moves off again. I do not want to miss the chance to make good money !
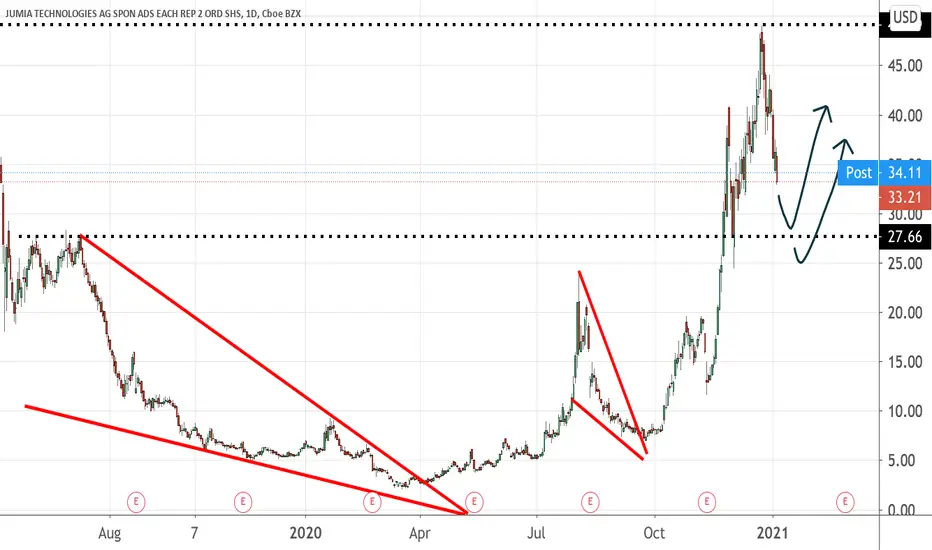
I bet many traders/investors would think along this line when they see stocks that had such phenomenal returns. If you had bought this share in early 2020 at around 2.50 and at current price of around 50, you would have made 20 fold returns. WOW< WOW< WOW........
Before you start throwing in the kitchen sink and sell your house to buy this counter, you may want to understand more.
Here's a great article for you to digest on .
Would I buy this company ? YES ! At this price ? NO.
My main concern is the share price has gone up too fast too soon. We can see that it has gone up 300+% from Nov to Dec 2020 and with no apparent good reasons. In fact, its Q3 earnings was rather disappointing. Does this raise a red flag ? And right before Christmas last year, it took the reverse turn and shares have fallen almost 18 dollars from its high of 50. I expect more selling to come within the weeks and possibly month.
That means, market manipulators are behind the scene to push up the price and millions of retail investors blindly follow and chased it up.
Just because they are primed as a market leader in e-commerce in Africa is NOT a strong reason to buy this share. It has to improve on its revenue, reduce its rate of cancellations, stabilise its business model, strategise on amount of online advertising, etc. Of course, at this time of writing, millions of retail investors may be bought by the growth story of Jumia and think it will be the next Alibaba or SEA Ltd. So, they won't want to miss the chance , would they ?
For me, this is a SKIP for now but I would definitely put it in my watch list and review it again.

JUMIA vs HFG: which of the two do you prefer for your portfolio?The mid-term trend charts of the two German multinational companies JUMIA and HFG are presented. ___
Prompt: New traders should take some time and carefully read the post entitled 'You can't beat the market' that is located in my profile.
Disclaimer
The author of this text is not an investment advisor. The preceding content is intended to be used for informational and educational purposes only.
It is not an advice or inducement for the purchase or sale of the products mentioned. Before making any investment based on your own personal circumstances,
it is very important to do your own research and analysis and also take independent financial advice from a professional to verify any information provided here.

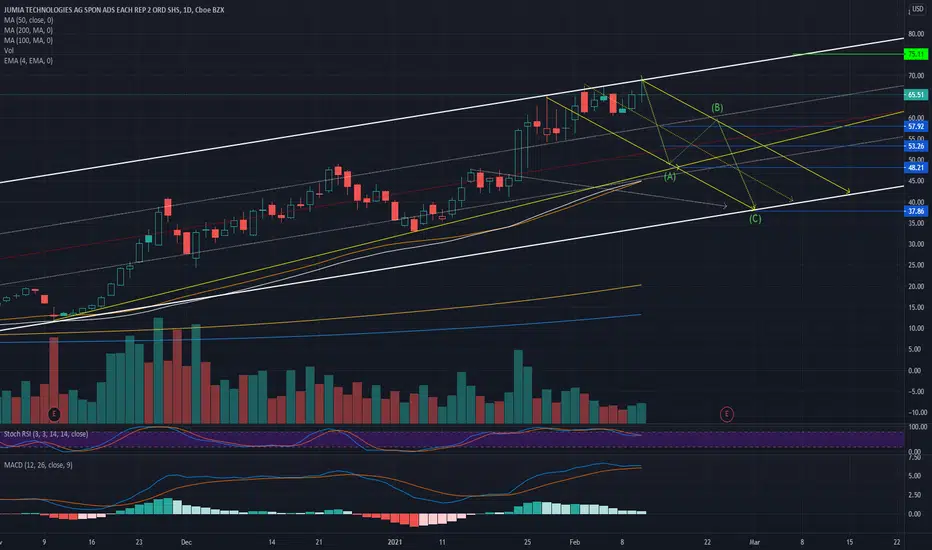
Jmia update and outlookHere's a bigger picture
White lines are channel lines on the daily
Yellow lines act as the trend line and support jmia has been riding since Nov
As you can see the area it's been trading in since Feb 1st has been a tight range which matches up with what's showing on the chart with the white channel resistance and the yellow channel support . Jmia should be making a big move in the coming days.
short entry would be 58$ / Stop loss at 60$
Long entry 75$/ stop loss at 70$
MFI is in overbought territory
Volume is dropping
MacD is verging Bearish
Let's see


$JMIA Price Raise Needed! Feb 8thAt a critical bounce level, and we could see a reversal if this support doesn't hold up.

$JMIA: $71+ Target Swing Trade TP#1JMIA looks like it is set to garnish even higher support levels next few days, and I think $71 is quite feasible. That said, please do your own due diligence and invest at your own risk. Everything I say is on an opinion based basis.


$JMIA - call options Grabbed call options when alert hit yesterday
Chicken-beak patter and break out then fade.
I buy further expirations to give me room to be wrong.
This will be a nice payout.

JUMIA JMIAJUMIA is super bullish and as you know I’ve always been bullish on this and I still am. It will be interesting to see JUMIA reach $70 post market today haha is that possible?
