Johnson & Johnson. Clean. Soft. Gentle. Growth.Johnson & Johnson (JNJ) stands out as a bellwether in the global healthcare sector, and its nearly 18% stock performance in 2025 reflects both robust fundamentals and compelling technical trends.
Fundamental Perspective
JNJ maintains a solid financial foundation, underpinned by consistently strong profitability, a diversified business model, and effective capital allocation. As of August 2025, JNJ reported trailing twelve-month (TTM) revenue of $90.6 billion and earnings of $22.7 billion, resulting in a net profit margin of 25% and a gross margin close to 68%. Key profitability metrics such as a Return on Assets (ROA) of 11.7%, Return on Equity (ROE) of 28.9%, and Return on Invested Capital (ROIC) of 13.6% underscore the company's operational efficiency relative to peers in the pharmaceutical industry.
From a financial health perspective, JNJ maintains moderate leverage, with a debt/equity ratio of 0.61 and an Altman-Z score of 4.17, signifying financial stability and a low risk of distress. The forward price/earnings (P/E) ratio is 14.9, suggesting that the stock is not particularly expensive for its sector, while the dividend yield remains attractive at 3.16%, appealing to income-oriented investors. The company’s free cash flow yield and high profit quality further enhance its fundamental appeal.
JNJ's growth narrative is fueled primarily by its Innovative Medicine and MedTech segments. Drugs like Darzalex and Tremfya continue to deliver high single- to double-digit year-over-year growth, and the MedTech segment is experiencing margin expansion due to scale and product mix improvements. Strategic acquisitions (notably Intra-Cellular Therapies), new regulatory approvals, and a deep late-stage pipeline (over 40 programs) provide resilience and new growth avenues, offsetting pressures from biosimilar competition, patent expirations, and legal settlements.
Technical Perspective
On the technical side, JNJ’s stock has demonstrated significant momentum. The price reached an all-time 52-week high above $170 per share in early August 2025, following Q2 earnings that exceeded expectations and prompted a nearly 6% surge in share price. Technical indicators are largely positive, with the stock trading above its 50-day and 200-day simple moving averages ($157.43 and $155.56, respectively), reflecting a prevailing bullish trend. The 14-day Relative Strength Index (RSI) stands at 55.85—neither overbought nor oversold—implying stable investor sentiment. Analyst price targets average $173, reflecting modest but continued upside.
A key technical resistance zone had developed around $167, which NYSE:JNJ has recently breached. The consensus among technical analysts is the potential for a substantial upward move towards $194 if the breakout holds, while support remains strong at around $140—historically a level where dip buyers emerge. Market sentiment remains bullish, with the Fear & Greed Index indicating broader market caution, while JNJ’s own technical indicators show "Strong Buy".
In long-term, JNJ has been supported earlier in 2025 by 10-year SMA, above which stocks are moving since 1980s, i.e. for the past 45 years (on end of year basis). In mid-term, the main technical graph indicates on major 5-year old bearish trend reversal.
Reasons for Recent Growth
JNJ’s recent growth is attributed to several convergent factors:
Strong Q2 2025 earnings performance, leading management to raise full-year revenue and EPS guidance above analysts’ expectations.
Continued strength in key growth drivers: new drug launches in oncology and immunology, robust MedTech expansion, and improved operating margins.
Favorable foreign exchange and a reduction in tariff costs, redirecting capital to R&D.
Positive pipeline developments and strategic acquisitions.
Successful navigation of legal risks and clarity regarding settlements (including talc litigation), which have reduced major uncertainties.
Broad overall market resilience and a rotation toward defensive healthcare shares.
In summary, Johnson & Johnson’s combination of strong and diversified fundamentals, attractive income profile, and bullish technical signals—amplified by improved guidance and innovation momentum—help explain the stock’s recent appreciation and continued investor confidence.
--
Best wishes,
@PandorraResearch Team
JNJ trade ideas
Johnson & Johnson Wave Analysis – 31 July 2025 Johnson & Johnson reversed from the resistance zone
- Likely to fall to support level 160.00
Johnson & Johnson recently reversed down from the strong resistance zone located between the long-term resistance level 168.15 (upper border of the weekly sideways price range from 2023) and the upper weekly Bollinger Band.
The downward reversal from this resistance zone stopped the earlier intermediate impulse wave (3).
Given the strength of the resistance level 168.15 and the overbought weekly Stochastic, Johnson & Johnson can be expected to fall to the next support level 160.00.

Johnson & Johnson Wave Analysis – 11 August 2025- Johnson & Johnson broke the resistance level 168.15
- Likely to rise to level 175.95
Johnson & Johnson previously broke the resistance level 168.15 (upper border of the weekly sideways price range inside which the price has been trading from 2023).
The breakout of the resistance level 168.15 accelerated the active medium-term impulse wave (3) from July.
Johnson & Johnson can be expected to rise further to the next resistance level 175.95, a former multi-month high from 2023 and the target price for the completion of the active impulse wave (3).

Johnson & Johnson | JNJ | Long at $146.00Johnson & Johnson NYSE:JNJ is strong (but highly controversial) company with anticipated earnings growth on the horizon. With a P/E of 23x, steady dividend growth record, low debt, and expected increased cashflow, the future is optimistic for NYSE:JNJ if they can stay out of the shady spotlight...
While the historical simple moving average I've selected suggests the stock is entering a downtrend on the daily chart, I'm going to go against this given the current price/position it is in. If the price can hold in $140's and then move up, there could be an early cup formation here. However, if the price drops below $140, that idea is out, and the near-term downtrend may be on. But the company, overall, is a personal buy-and-hold for the long-term ups and downs (unless new news points the company in a different direction). Thus, at $146.00, NYSE:JNJ is in a personal buy-zone.
Target #1 = $157.00
Target #2 = $165.00
Target #3 = $170.00+

JOHNSON & JOHNSON Sell opportunity on a Double Resistance.It's been 9 months (October 11 2024, see chart below) since our last Johnson & Johnson (JNJ) analysis, where we gave a very timely sell signal that surgically hit our $141.00 Target:
The Channel Down has since broke to the upside and a new Higher Lows structure has emerged but with a clear Resistance Zone for the time being. At the same time, the price is also just below the Higher Highs trend-line that started on the September 04 2024 High.
With the 1D RSI overbought (same as on February 25 2025), we don't give the upside much room to go, so we turn bearish here, targeting the 0.382 Fibonacci extension and Higher Lows trend-line at $160.00.
-------------------------------------------------------------------------------
** Please LIKE 👍, FOLLOW ✅, SHARE 🙌 and COMMENT ✍ if you enjoy this idea! Also share your ideas and charts in the comments section below! This is best way to keep it relevant, support us, keep the content here free and allow the idea to reach as many people as possible. **
-------------------------------------------------------------------------------
💸💸💸💸💸💸
👇 👇 👇 👇 👇 👇

JNJ watch $156.72-158.17: Double Golden Fib zone about to break?JNJ struggling against Double Goldens at $156.72-158.17
After many tests from underside, it looks ready to break.
Above this zone are only scattered clouds for some ways.

JNJ - Macro View 🌐Hello TradingView Family / Fellow Traders. This is Richard, also known as theSignalyst.
📈 JNJ has exhibited an overall bullish trend, trading within the ascending wedge pattern outlined in blue. It is presently nearing the lower boundary/blue trendline.
At present, JNJ is undergoing a correction phase and is trading within the descending red channel. It is currently approaching the lower limit and a highlighted demand zone in green.
🏹 Thus, the highlighted purple circle is a strong area to look for buy setups as it is the intersection of the green demand and lower blue and red trendlines acting as a non-horizontal support.
📚 As per my trading style:
As JNJ approaches the lower purple circle zone, I will be looking for bullish reversal setups (like a double bottom pattern, trendline break , and so on...)
📚 Always follow your trading plan regarding entry, risk management, and trade management.
Good luck!
All Strategies Are Good; If Managed Properly!
~Rich

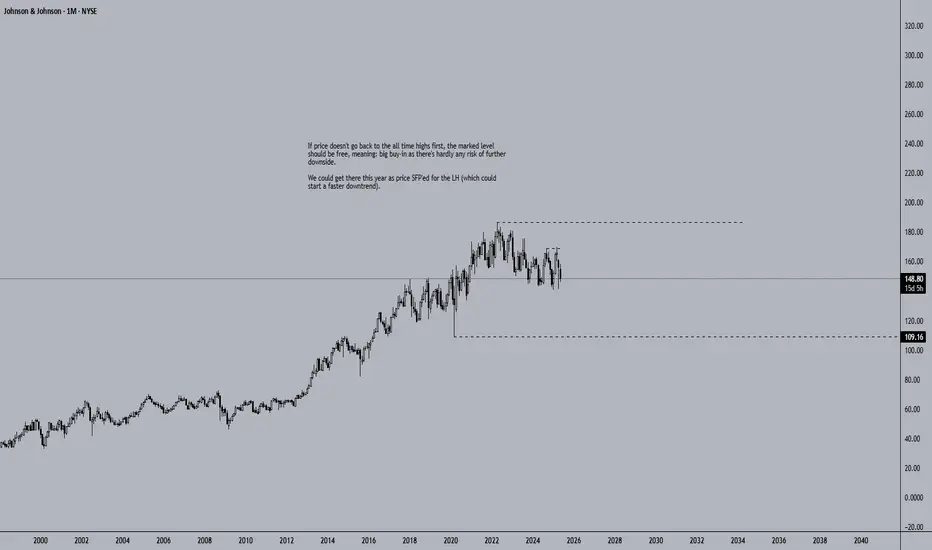
Johnson & Johnson Could Be FreeIf price doesn't go back to the all time highs first, the marked level should be free, meaning: big buy-in as there's hardly any risk of further downside.
We could get there this year as price SFP'ed for the LH (which could start a faster downtrend).
JNJ - Where are you heading Johnson?Good Morning,
Hope all is well. Chart explains it all. Still in a downtrend JNJ is fighting. Looks like we have some momentum forming, lets see how strong it is. Failure to break EMA/Resistance would be bearish, otherwise a break would be bullish.
Enjoy!

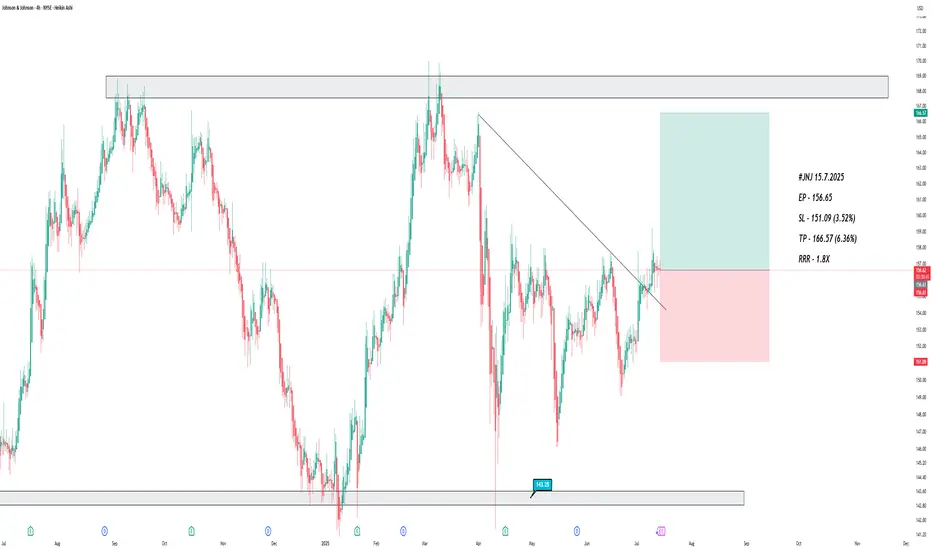
JNJ - 2 scenariosHi traders,
JNJ is currently consolidating inside a symmetrical triangle.
We can expect two scenarios:
Bullish scenario:
Open a long position if the price breaks the downsloping resistance line.
SL: below $153.50
Potential TP: $164
Bearish scenario:
Open a short position if the price breaks down and closes below the upsloping support
SL: above $158.00
Potential TP: $149

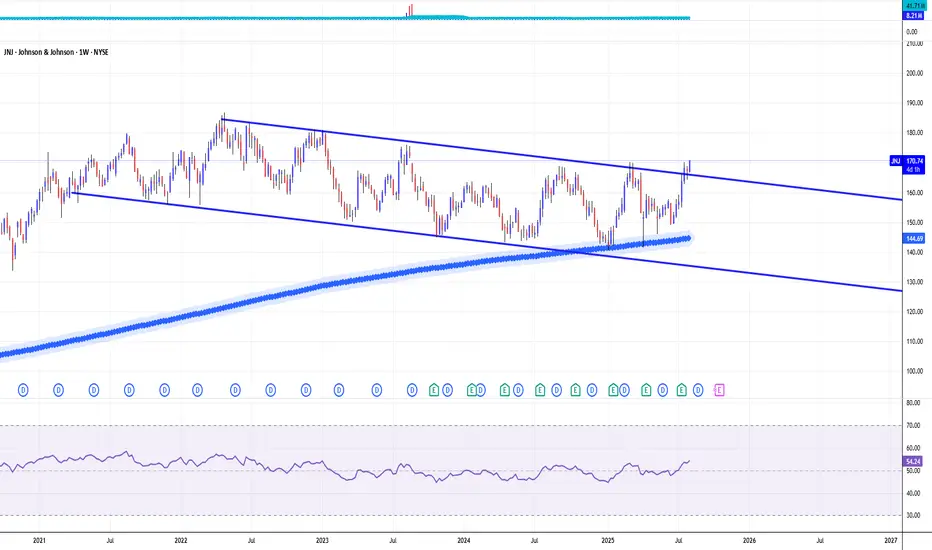
JOHNSON AND JOHNSON: Re-accumulation is targeting $175.JNJ is neutral on its 1D technical outlook (RSI = 49.991, MACD = -1.040, ADX = 18.184) as it's only trading around its 1W MA50 but having made an impressive rebound 4 weeks ago inside the Demand Zone. This is the 4th time this Demand Zone provided a rally and the last one even crossed over the 3 year LH trendline that kept the stock on a downtrend since 2022. The breakout confirmed the emergence of a HH trendline which is taking the stock on a new multiyear bullish path. We expect at least one more high on the HH before the end of the year (TP = 175.00).
## If you like our free content follow our profile to get more daily ideas. ##
## Comments and likes are greatly appreciated. ##

JNJ watch $156.72-158.17: Double Golden zone to determine TrendJNJ consolidating around a major zone defined by dual Goldens.
Key is Golden Genesis at $156.72, and Golden Covid at $158.17
This is an important zone that everyone is now keenly aware of.

Long and LongerMomentum demonstrated in the recent chart is significant enough to break out of anything sideways.
Potential for an increase to a $200 JNJ is not unreasonable.

Buy JNJ for Stable Gains Amid Earnings Optimism Next Week
- Key Insights: Johnson & Johnson demonstrated robust earnings performance with
an EPS of $2.77, surpassing consensus estimates and reinforcing its
defensive stock status. Its diverse portfolio and consistent ability to
execute in volatile markets make it a strong candidate for growth-oriented
and stability-focused investors. With a positive sentiment surrounding
large-cap equities, JNJ is likely to continue attracting capital.
- Price Targets: Next week targets for LONG positions: T1=$166, T2=$170. Stop
levels: S1=$157, S2=$155.
- Recent Performance: JNJ outperformed expectations in its latest earnings
report, showcasing profitability and resilience in the face of broader
economic headwinds. The company delivered solid results while navigating
inflationary pressures, confirming its strength as a defensive player in the
healthcare marketplace.
- Expert Analysis: Analysts remain optimistic about JNJ’s execution
capabilities, citing its strategic investments in R&D and global footprint.
The earnings beat is seen as a validation of management’s effectiveness in
maximizing profitability through cost controls, alongside maintaining strong
demand across pharmaceuticals, medical devices, and consumer health
segments.
- News Impact: Broader market optimism surrounding strong earnings across top-
tier corporations (e.g., Abbott, Goldman Sachs) enhances JNJ’s prospects for
an earnings-season rally. Sector-wide attention on healthcare innovation
further bolsters JNJ’s defensive appeal amid global health concerns, while
its pricing power shields it from inflationary impacts.

Johnson & Johnson Wave Analysis – 18 April 2025
- Johnson & Johnson rising inside weekly price range
- Likely to test resistance level 165.60
Johnson & Johnson continues to rise in the primary upward impulse wave 3, which started earlier from the major support level 145.00 (lower border of the weekly sideways price range from 2023).
The upward reversal from the support level 145.00 previously formed the weekly Japanese candlesticks reversal pattern Hammer Doaji – which reflected the strength of this price level.
Johnson & Johnson can be expected to rise to the next resistance level 165.60, the upper border of the active sideways price range.

Johnson & Johnson Beats Q1 Estimates, Premarket Not Doing WellJohnson & Johnson (NYSE: NYSE:JNJ ) on Tuesday reported better-than-expected Q1 results and lifted its sales forecast for the full year.
Johnson & Johnson (NYSE: NYSE:JNJ ), together with its subsidiaries, engages in the research and development, manufacture, and sale of various products in the healthcare field worldwide, operating in two segments, Innovative Medicine and MedTech. Posted adjusted earnings per share (EPS) of $2.77 on revenue of $21.89 billion.
However, analysts had expected $2.56 and $21.56 billion, respectively, according to estimates compiled by Visible Alpha.
Price Action
Shares of Johnson & Johnson (NYSE: NYSE:JNJ ) were up about 1% immediately following the report, but the uptick was shortlived as the stock is down -0.54% in premarket trading. They entered the day up about 7% since the start of the year.
The company lifted its projected sales range to $91.0 billion to $91.8 billion, up from $89.2 billion to $90.0 billion previously. It also held its adjusted EPS forecast steady at $10.50 to $10.70, "including tariff costs, dilution from the Intra-Cellular Therapies acquisition, and updated foreign exchange."
Since reporting a disappointing 2025 sales outlook in January, the company closed its nearly $15 billion acquisition of Intra-Cellular Therapies and announced plans to lift its U.S. investment to more than $55 billion over the next four years.23
Technical Outlook
Shares of NYSE:JNJ closed Monday's session up 1.73% and despite the Q1 Earnings beat, the premarket session tells a different story as the asset is down 0.54% in Tuesday's session.
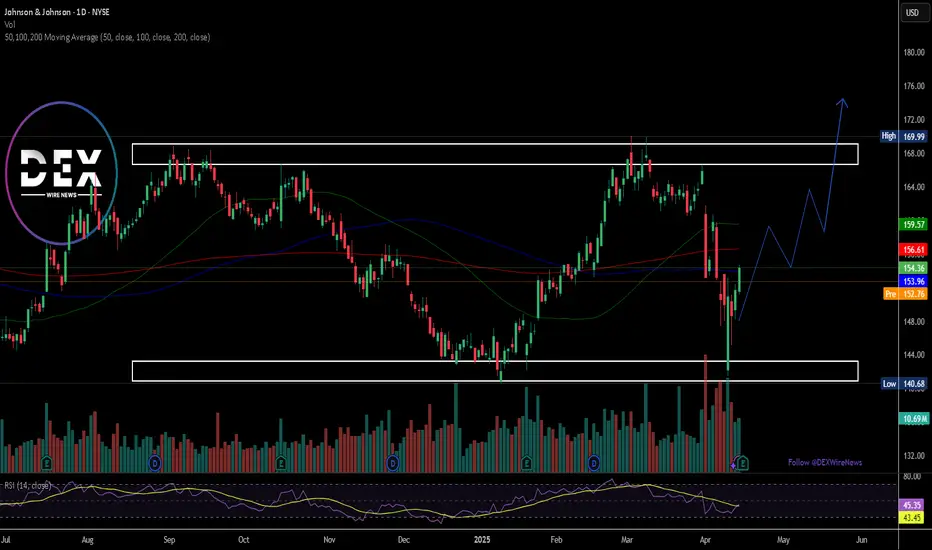
The asset is trading within an enclosed rectangular formation with a perfectly formed support and resistant zones as indicated in the chart. A break above the the key moving averages could cement a bullish breakout that may resort to a break above the $169 resistant point.
With the RSI at 45.35, NYSE:JNJ is well positioned for a bullish campaign once traders digest the earnings news.
Johnson & Johnson (JNJ) Shares Drop Over 7%Johnson & Johnson (JNJ) Shares Drop Over 7%
As the chart shows, Johnson & Johnson (JNJ) shares declined by approximately 7.6%, reaching their lowest level since late February. This marked one of the worst performances in the stock market yesterday.
Why Did JNJ Shares Fall?
Two major bearish factors contributed to the decline:
A Texas judge rejected Johnson & Johnson's third attempt to settle lawsuits related to allegations that its baby powder and other talc-based products harmed consumers.
On Tuesday, Johnson & Johnson announced that its upcoming acquisition of Intra-Cellular Therapies is expected to dilute adjusted earnings per share by approximately $0.25 for the full year 2025. Investors appear to have reacted negatively to this outlook, despite the company’s expectation that the deal will generate around $700 million in additional sales.
Technical Analysis of JNJ Stock Chart
Price movements in 2025 have formed an ascending channel (marked in blue), with indicators highlighting how:
→ The channel’s boundaries have acted as support and resistance levels.
→ The channel’s median line has served as a “magnet” for price action, reflecting the balance between supply and demand.
As JNJ's share price approaches the lower boundary (circled), just above the psychological support level at $150—previously a key level in February—traders have reasons to anticipate that the decline may slow down or even lead to a significant rebound from this support area.
This article represents the opinion of the Companies operating under the FXOpen brand only. It is not to be construed as an offer, solicitation, or recommendation with respect to products and services provided by the Companies operating under the FXOpen brand, nor is it to be considered financial advice.

JNJThe JNJ stock is in a strong downtrend and has bounced back four times from it. We expect the stock to make a new low below $140, with a stop loss if it breaks above the last high at $167.

JNJ watch 156.72: Golden Genesis fib for support after news dumpJNJ got some bad news apparently, in the talcum lawsuit.
The news dump has dropped into a couple of MAJOR fibs.
Golden Genesis at $156.72 and a Golden Covid at $158.17

Cracks Appearing in J&J's Armor?Johnson & Johnson, a long-established leader in the global healthcare sector, confronts substantial challenges that raise significant questions about its future trajectory and stock valuation. Foremost among these is the persistent and massive litigation surrounding its talc-based baby powder. With tens of thousands of lawsuits alleging links to cancer, the company's strategy to manage this liability via bankruptcy has been repeatedly struck down by courts, most recently rejecting a $10 billion settlement proposal. This forces J&J to potentially face over 60,000 individual claims in court, introducing immense financial uncertainty and the prospect of staggering legal costs and damages.
Compounding these concerns is mounting scrutiny over the company's historical and recent marketing practices. A federal judge recently imposed a $1.64 billion penalty against J&J's pharmaceutical arm for misleading marketing of HIV medications, citing a "deliberate and calculated scheme." This follows earlier multi-million dollar settlements related to alleged improper financial inducements paid to surgeons for orthopaedic implants by its DePuy subsidiary, and tax disputes in India over questionable "professional sponsorship" expenses tied to similar activities. These incidents depict recurring legal and ethical entanglements with significant financial penalties and reputational harm.
Taken together, the unresolved talc litigation, substantial financial penalties from marketing violations, and persistent questions regarding ethical conduct create considerable headwinds for Johnson & Johnson. The cumulative impact of ongoing legal battles, potential future liabilities, and damage to its corporate image threatens to drain resources, divert management focus from core operations, and erode investor confidence. These converging factors present tangible risks that could exert significant downward pressure on the company's stock price moving forward.

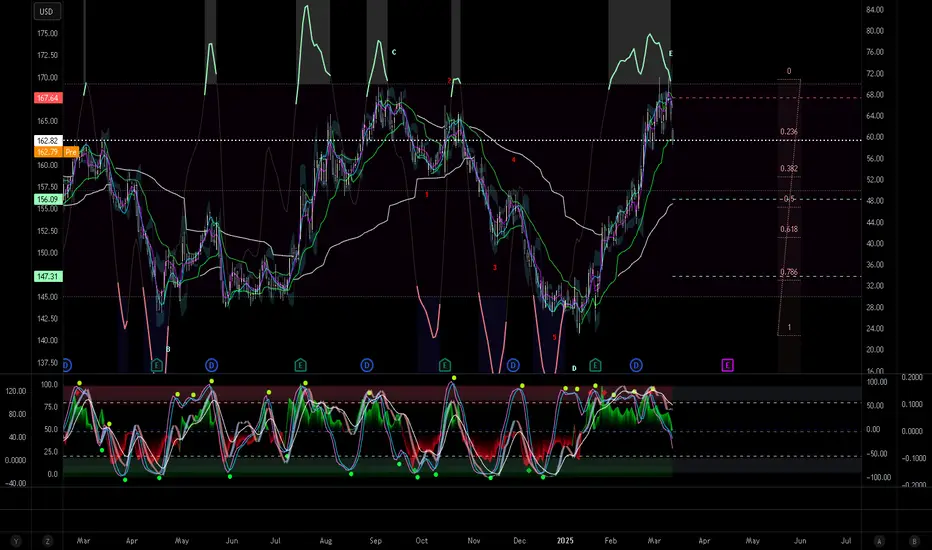
Johnson&Johnson: Rejected AgainJohnson&Johnson has now been rejected at the $168.75 resistance level for the second time, pulling back more noticeably in response. However, in our primary scenario, we still expect an imminent breakout above this level, which should allow the turquoise wave X to establish its high well above it. Afterward, the turquoise wave Y should drive the stock sharply lower again, as we anticipate the low of the larger green wave in the corresponding long Target Zone between $138.78 and $125.75. That said, reaching this Zone is not a certainty. There remains a 35% chance that the low of the green wave alt. is already settled. Under this alternative scenario, the stock would break through $168.75 without resistance and continue its impulsive move higher.

Johnson and Johnson Falling Off a Cliff. JNJA much larger ABCDE formation is complete, not pivoting back to gravity. There is confirmation with MIDAS cross of price action with supporting of RSX exiting OBOS area and VZO/Stoch duo being bearish divergent for some time now. The incoming stream could be a tumultous C Wave impulse to the bears, if Elliott is to be believed.