Jpm Trade Opportunity This ascending triangle on jpm looks amazing, I really don't have anything else to say the chart speaks for itself.
JPM trade ideas

$JPM looking for big move this weekIncreasing volume over last week after having a great earnings report. Also finished near hod on Friday.

JP MORGAN analysis. I'm new share your ideas!Disclaimer: I am not trading for real I am doing paper trades just looking to learn. I just started trading and have been learning some things and would love some feedback.

#JPM Double top on ATH www.tradingview.com
NYSE:JPM
Nice double top on all time high price.
Waiting any signal for short or pullback of the breakout for long.

JP Morgan support at $160.43 for new all time highsLong Term UPTREND since 010221
Medium Term UPTREND since 161120
Short Term UPTREND since 240921
PIVOT 160.43
Long positions above 160.43 for new all time highs
Short positions below 160.43 for 147.79 and 118.73


JPM TRIGGERED FRESH BEAR SIGNALThere is a wolfe wave setup on the Daily time frame. The projected target is calculated by extending a linear line between pivot 1 and 4 and projecting the line. This is represented as the red perforated line, as shown in the chart. There are a few targets shown in the chart. Gap targets at 157 and 155. Bearish wolfe wave target is projected to be approx 143. We expect to reach this price target within 21 days.

Earnings in Tomorrow BMOCup and handle.
Mid cup is 158.55. Cup low is 145.71. Depth is 21.73.
Support is often found below the handle low (HL) or mid cup.
No recommendation/I think JPM is expected to beat the number. It is often not the news but the reaction to that news which can make or break you.

JPM break out rectangle pattern On weekly.Break out weekly . MACD shows bullish sign. May go up till earnings .

$JPM LT Breakout, Bullish Options Flow$JPM Long term Breakout, Bullish Options Flow
Over $500M in Jan'2022 deep in-the-money calls bought yesterday (roughly 10x open interest)
Medium term target: $200-$210 range by Q1
Note: This is NOT investment advice. Educational only.

JP MORGAN UPMOVE JP Morgan already in Upmove, can carry position with SL 156 or New Buy near 160 and carry it for target 30 percent in next one year

JPM has reached to it's highest resistance , possibly shortNYSE:JPM
hello guys , I wish you're all fine .
JPM touched 168$ which has been a nice resistance on June 03 2021
Also the candles looks bearish in 1h and 4h
RSI is at 67.85 and overbought
------
Also I think because of the fear of inflation in U.S and also low CB Consumer Confidence which was reported today and caused stocks to fall and bearish , JPM has not fallen enough in comparation to the other stocks .
So probably on Wednesday when the market opens , we must see what's gonna happen to JPM
I go for a short position .
what's your idea guys ??
is JPM still bullish or it's bearish now ??
!! this is just a personal analysis and this person has no responsibility of your trade and risk !!

$JPM can this breakout holdOther banks are near a breakout point as well. Possibly looking at the big boy JPM and seeing if she can hold herself here. I hope so. Looks beautiful.

JPM LONGentry 1: 156
stoploss: 152
risk : 0.66% of balance
====================
entry 2: 152
stop-loss: 148
risk : 1.33% of the balance
====================

JPM 4H - SHORTStock Market Trading is dangerous and non profitable for most of you out there. Follow signals, make money. Period.
How to use my signals?
LONG: Buy and hold as long as the price stays above the green zone.
SHORT: Sell and hold as long as the price stays below the red zone.

Triangle- Watching closelyWatching the financials closely in the coming few weeks, JPM closing on Friday sitting right on the 50day EMA and holding a little bull flag as well. will undoubtedly be a long-term play but definitely worth noting that there was a very clear bear flag on the XLF last week that could potentially continue to play out, so something to keep in mind. However, personally am bullish on financials here- Just some support and resistance levels to keep an eye on along with some RSI based supply and demand zones

JPM make it or breakGreat opportunity on JPM
Sitting at support from this triangle, if banks continue to be weak this week, there is a chance it will lose support and have a leg to the downside,
Another possibility is a breakout to the upside targeting ATH

JPM: Breakout to ATH again? JPM is starting to breakout here on the 4hr chart and is currently up about 2% on the day. We're breaking out of the wedge and it is trading above both moving averages. Monitoring to see if JPM can make a move towards $167, which is the all time high, 3%-4% upside per share.Also, it has hit FIB 0.382, the risky part that it might be a rejection in this wedge especially when market is flat or down. If it doesn't breakout this time, there is a potential that it will be in near future.

Long $JPM ( $QQQ $SPY $SPX )Financial sector is been performing strongly
Buy JPM on this pullback
First target 162$

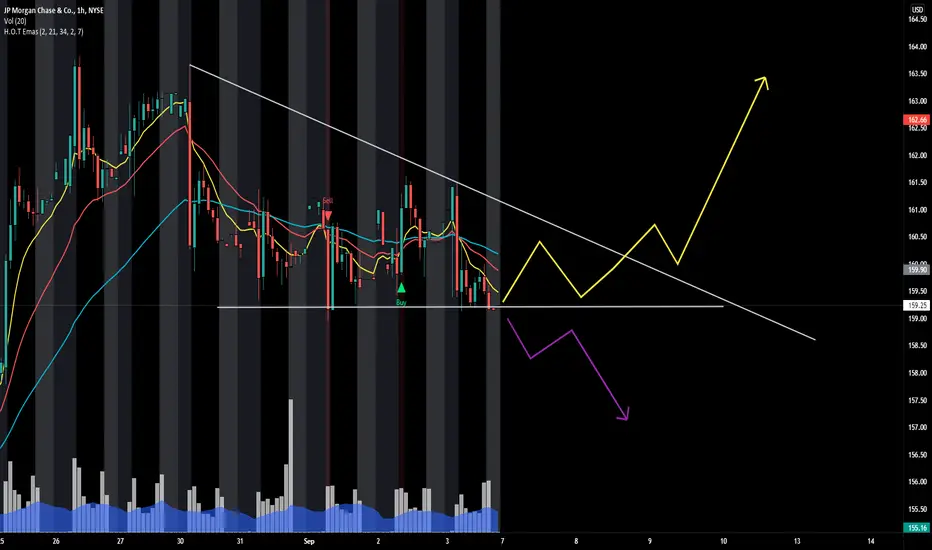
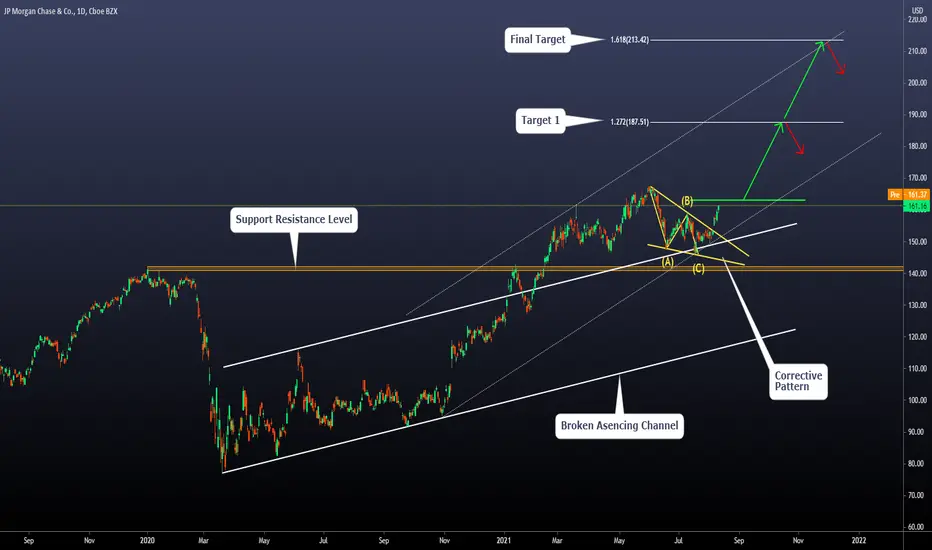
JPM daily perspective and possible impulse coming.Today we will take a look at the JPM chart:
What are the main things we can see here?
a) The price is above the last support/resistance level.
b) The ascending channel has been broken, and the price is currently supported on the broken structure
c) We can see a complete ABC corrective pattern
d) Projecting a new channel assuming that the price makes a new ATH, we can see a convergence with fibo levels using the previous impulse
What conclusions can we take with this?
a) f the price reaches our green horizontal line, we will consider that to confirm our bullish view.
b) The targets we will be using are the two levels we have drawn using Fibonacci extensions
c) Ok, what happens if everything goes wrong? Our stop loss will be below the Corrective pattern.
d) If the setup is never activated and the price falls below the structure, we will cancel our view.
e) The risk we are taking on this setup is 1% of our trading capital.
f) This is another setup of the stock strategy we are applying on the markets. The expected win rate of this is between 45% - 55%, which means that we tend to be wrong half of the time. However, when we are right, we make around 1.8 to 2.5 times what we lose.
g)The expected movement can take between 150 - 250 days.
Thanks for reading guys!
JPM looking much better here.Right at pivot resistance after a breakout out last week. I'd like to see it rest for a day or two which would create a good R/R setup but may not get it.

JPM: Trendline brokeA call was given on 26th July, bought at 150.66. Profit should now be 110% of the risk risked. As the trendline has broken so we can expect some more momentum in near future, you may move your stoploss along with the price to secure your trade.
