LUV trade ideas
Southwest Airlines a Paradise?Southwest recently started flying to Hawaii, and the stock price had a roaring January! Southwest continues to grow and the Megalodon is giving the buy sign on the technical side!
The Megalodon indicator uses an artificial intelligence, combined with data from over 500 buy setups, and over 2000 indicators to produce extremely accurate buy signals on any and all asset classes! Send me a message if you would like to try it for yourself!

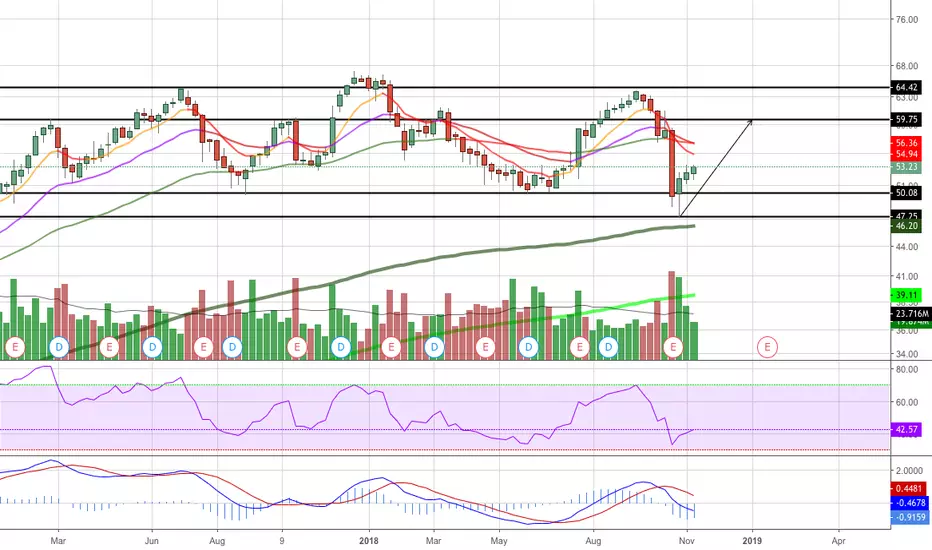
LUV looking to test the upper limit of the trend line at 61.95as you can see, the LUV has a lot of impulse right now and is moving agressively above the trend line, I figure before surpassing that line it would need to bounce from the lower level trend line.

A (LUVLY) Head & Shoulders formationA well-defined Head & Shoulders formation has been created since January of 2017 (this is a two-year-bearish formation). Long story short, the price is expected to be testing the formation's neckline (around the $50.00). An ideal initiation of the short-idea would be a confirmed (bearish-reversal) candlestick on the weekly chart. The candlestick should be somewhere below the peak of the right shoulder, preferably near the neckline.
*Always remember: this is an opinion, not a recommendation*
May the trend be with you

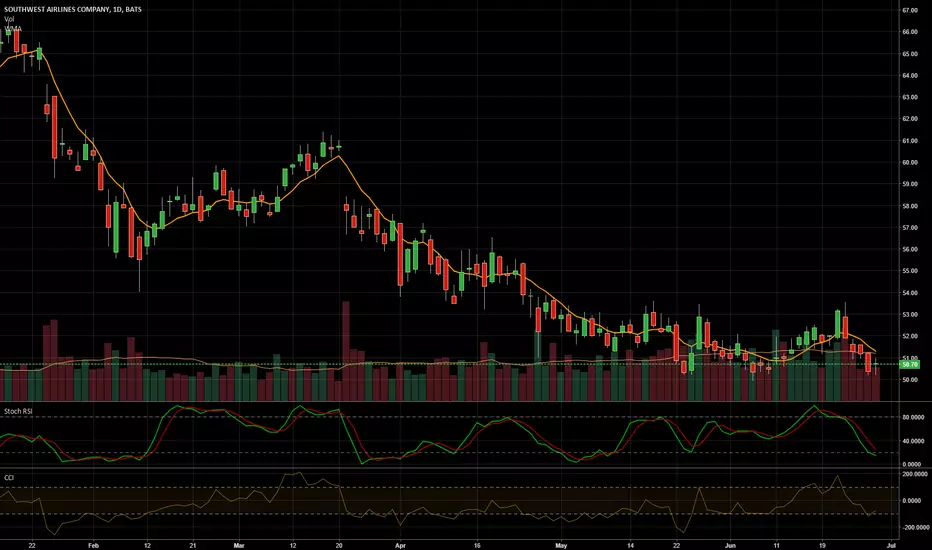
LUV Reversed Off Resistance, Potential Further Drop!LUV reversed off its resistance at 47.23 (61.8% Fibonacci extension, 23.6% Fibonacci retracement, horizontal overlap resistance) where it is expected to drop down fruther to its support at 44.43 (horizontal swing low support).

el mejor escenario posible para LUVDe otra forma lo vemos breakdown hacia el proximo test level del support anterior.

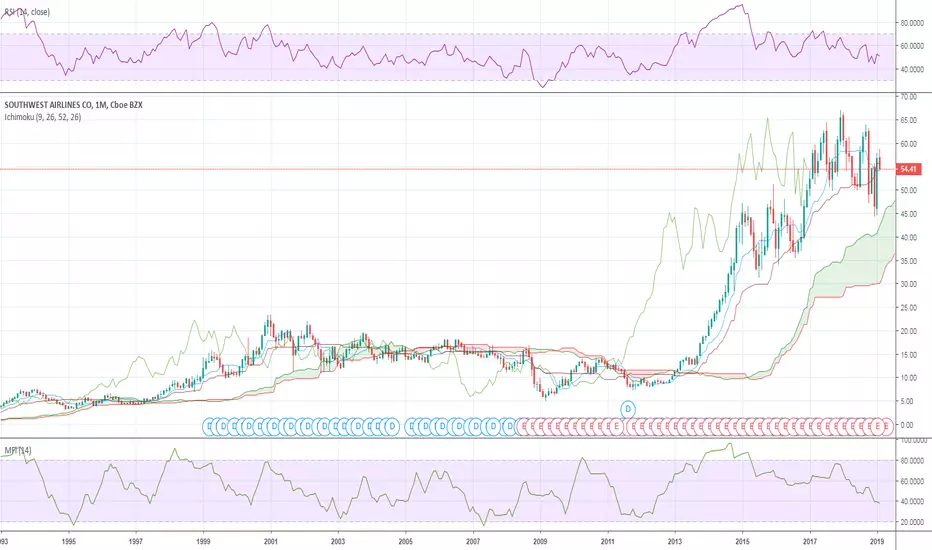
DEATH CROSS Incoming - Beware!! SouthWest Airline might Test $36Notice the goldeen cross back in 2013 and how well it went from there, but hey nowadays we are in a different scenario in the market and notice how this death cross in the weekly is playing along with the very low RSI and the price action is bearish AF!! look for a bounce here and try to get out when it test resitance in the 9 EMA at around $55.00.

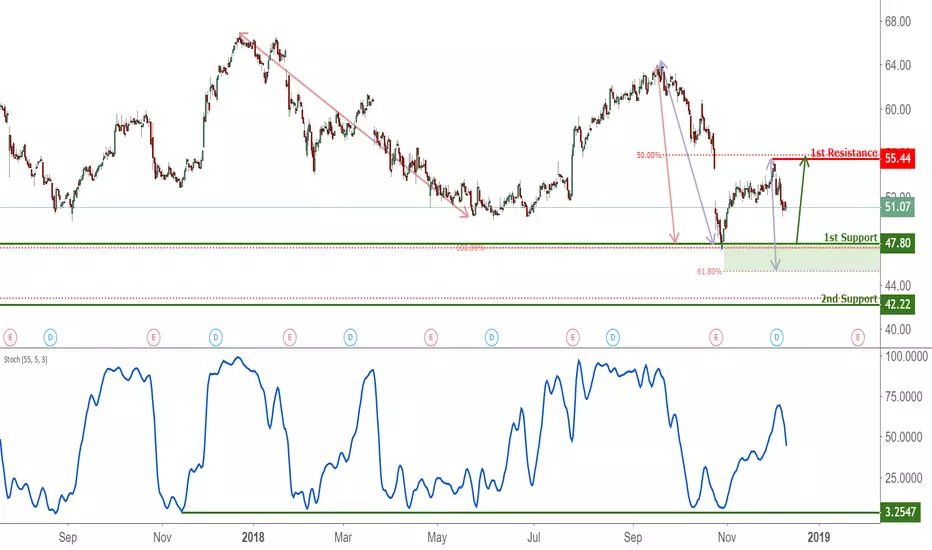
LUV Approaching Support, Potential Bounce!LUV is approaching its support at 47.80 (100% & 61.8% Fibonacci extension, 61.8% Fiboancci retracement, horizontal swing low support) where it could potentially bounce up to its resistance at 55.44 (50% Fibonacci retracement, horizontal swing high resistance).
Stochastic (55, 5, 3) is approaching its support at 3.2% where a corresponding bounce could occur.

LUV Approaching Support, Potential Bounce!LUV approaching support at 47.80 (100% & 61.8% Fibonacci extension, 61.8% Fibonacci retracement, horizontal swing low support) where it could potentially rise to its resistance at 55.44 (50% Fibonacci retracement, horizontal swing high resistance).
Stochastic (55, 5, 3) is approaching its support at 3.2% where a corresponding bounce could occur.

LUV Potential Reversal Patternlooks to have found support at $50 and may head back towards resistance now
Some More SpaceThe attempt to correct deciesively downward failed and the price is back on the path upward.


LUV Swing trade!Looks like it also has potential to reach resistance again! Once i hit my target I will trail. All from a previous morning star pattern!

Southwest small pullback before testing higher levels Looking at southwest I was initially enthusiastic about an easy move to around the $61 level. After reaping the rewards of some strange earnings yielding a near 9% return on the 26th of July, I decided I would stay in my position for one more day and see how the momentum would swing. When I was up nearly 2.42% ($58.08 luv) I decided to sell. Even though the volume was continuing its explosive path I noticed from the previous major trough where explosive price action took place had many similarities to the divergence that was forming right now. I think on Monday or Tuesday I small pullback will occur before the larger gains happen week on week for a couple months potentially testing new all time highs. Also not to go into too much depth because this trade is really out of greed and just trying to earn some extra shares while I can, the current RSI levels seem to be testing historically hard levels to sustain. If I had to put my faith into one indicator and one indicator only, it's RSI. When Southwest historically tests the low 70's to mid 80's it doesn't last long and a small (or big) reversal occurs. Lets see how the momentum can fully play out next week!
Happy trading :)

I LUV Dow Theory.Lets look for a retest into recent channel then bounce. Earnings is around the corner.


LUV the setup -- almost go timeLooks like we are soon to be on our way. This should be a pretty long term hold, so I will be adding to shares on any pullbacks which retain the structure

Chart and Technicals looking brighterchart and indicators at all time frames (D,W,M) looking good here, lets see if it can fly to 61
While the currencies sleep.... LUV looks AMAZING!I'm a heavy forex trader but sometimes the forex market just sits and makes us wait and when that happens I jump all over stocks (and vice versa)
Right now I'm watching Southwest and it looks great, $50 is a major support zone and channel low, if that holds I like getting long (vertical put spread or call options) for a move into the high $50's. However if $50 does not hold I don't want to hang onto this stock, it could get messy below that support.
Happy trading, let's make some bucks!

LUV this setup! (long term)I like this setup for much higher. High R.R since I will be long as long as we are above 48 on a closing basis. Over the next year, I expect a visit of 65 first, and once that goes, much higher (will update targets with price movement)

