Sunday Prep 8/01 - $LVS LONGThinking if this can speed up down towards 37 level I would be a buyer for a bounce. Keep in mind, this is weak due to looming lockdown possibilities from Covid resurgence.
LVS trade ideas

Clear Divergence - Las Vegas Sands (LVS) Long
For nearly two weeks LVS RSI has been increasing and price falling.
The earning were used to dump it (for now) - even thought they beat on estimates.
Friday was fresh 52 week lows on 70% of normal volume.
Its possible that Markets Movers grind it down a little more - but this looks like its going to spring back to $50+
If nothing else there should be some mean reversion two areas that stand out are at the 1.61% at VPOC and 2 at VPOC too - which is the first target around $49.40
Options market is cheap - Aug 20 48c were 34 cents Friday on the close - there may chance early in the week to get in.


The chart and trend lines can reveal a lot of stuff !1. Weekly trend is stuck in a consolidation phase for the last 11 years , price ranging between 34.92 to 82.20.
2. From Mar 11 to Aug 12, there were 4 buying opportunities as price was well supported at 34.92. That means, had you bought it and sold off at 82.20 you would have made a one fold profit.
3. Selling opportunities were lesser and less frequent. It appears on Mar 14 and May 18, 4 years apart when it hit the resistance at 82.20 level. After May 18, price has failed to break higher , in fact from chart we can see lower highs in each year.
4. The nature of the business requires the rich and wannabes to hang out at their glamours casinos and spent money. The Covid 19 situation has exacerbated the entertainment industry ! It brought many small lounges, bars , etc to bankruptcy and out of business.
5. Now, with the delta variant virus, it is a double whammy to the simmering hope that the entertainment industry was clinging on and desperately needed to get out !
In conclusion, I will not invest in such companies for the long term as its business is very dependent on the participation of its customers on site. Not forgetting the online gambling scene is getting more aggressive, trying hard to steal a slice of this multi billion industries.

Bet On The House LVS has emerged from the trenches of its COVID-induced bottoms as it had at one point over doubled from its trough. Yet, recently it has seen another bear market as it has sold off roughly 25%. However, the company is in a way better position to capitalize on both the reopening of the world economy and cheaper financing from lower rates. The finances support this backdrop as its current asset has risen to $5.63B as its liabilities have remained subdued to $2.46B as of Q1 2021. This gives it a current ratio (assets/liabilities) of 2.3, the healthies the company has seen in several years.
Additionally, the company owns some of the best gambling assets in the world including the Venetian in Las Vegas, Marina Bay Sands in Singapore, and the Parisian in Macau. These assets may flourish as travel pick up around the world. Individuals and businesses will begin to spend more money on leisure and conventions which will ultimately drive the bottom line for these assets. Las Vegas Sands's global exposure also allows for diversification and global exposure to entertainment opportunities. The company has also flirted with the potential for a sports gambling and esports division which could drive growth in the future.
Finally, the company releases on July, 21 which will give a portal into the outlook of its revenue and income. This will be the ultimate driver of the price action of the stock in the short term.
Bet on the house.

Bias on bearish due to delta variantBias on bearish due to delta variant
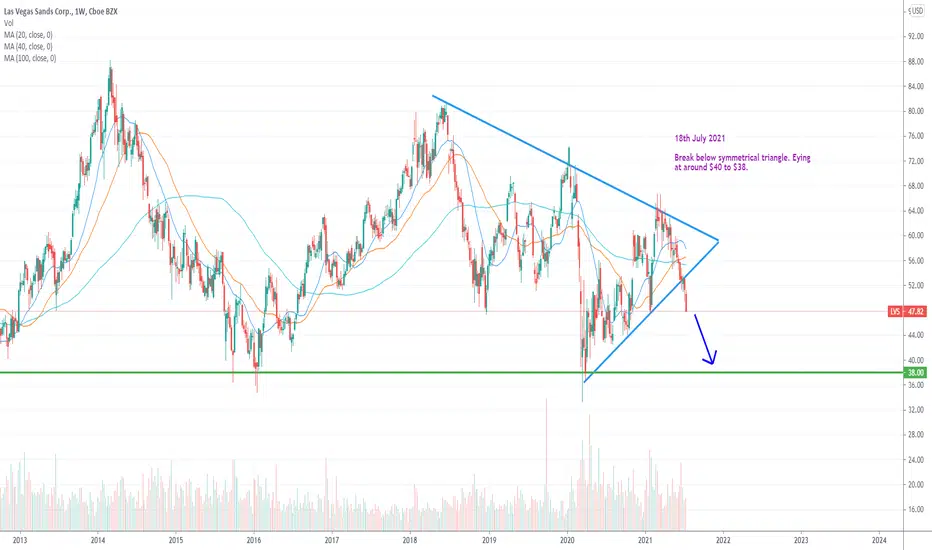
Break below symmetrical triangle, eying TP @ $40/$38
$LVS Las Vegas Sands Great R/R Swing
Hopefully you find the chart helpful in terms of Supports & Resistance etc.
we refrain from adding commentary on the chart as that is reserved for our members and we are very conscious of not giving financial or trading advice.
Thank you for taking time to consult our chart and we would really appreciate a like, follow or comment.

LVS - Potential Bullish Upswing Based on Historic PerformanceLVS has a historic performance of dropping before earnings and then increasing after. Right now, earnings is about a month out still. LVS at the moment is in a downward channel and had decreased over the past month. I am looking to see LVS performance over the next 2 weeks. In the time being, it might be smart to enter right now for a quick swing, as LVS has decreased over the past month and might see an upwards movement before a correction in time for earnings. If LVS drops before earnings after the week of 7/12, I plan on entering long for about a month. LVS normally sees bull runs last 2-3 weeks. Happy trading all. I am not a financial advisor.


$LVS | Bullish Descending Channel: Expect A Bounce$LVS is trading at the lower trendline of a bullish descending channel. Watch for confirmation on a lower timeframe for long entries.


$LSI Daily Chart $LSI daily chart:-
-----------------------
Bullish Sentiment:-
RSI is oversold 32%. Short Float is 3% reduced from 7% . 200 SMA is above the price line. Monthly is in uptrend, so a perfect swing.
Bearish Sentiment
Broke down the down channel. Its 4th leg, so it may go down further, 20 SMA crossed down to 200 SMA .
If I play this stock, I will buy it with a stop loss at $47.19 .
--This is my personal log

$LVS - Monthly Chart | Swing | Uptrend $LVS Monthly Chart , Next resistance will be at $66.75. The trend line and this resistance crosses this price, Also Fibonacci extension showing the near by price. It may form a double top around this price/ .
--. The Fibonacci showed in dashed line
-- This is s my personal opinion for my own log

Monthly chart for LVS ideaHere you can see LVS was trading on a bit of an incline headed into 2020, then covid happened of course and practically forced a double top at 81 and since then we have seen a lower high and another massive sell off in march followed by another lower high to confirm the trend. The play here is simple, calls if she holds ascending support, puts on a break and hold under support.

LVS week of 6/28Been waiting on LVS for a while now, looking at a possible multi week mover either way. Here on the 4hr we have a clean cut descending channel looking for a bounce off long term support, I have a feeling we will reach down to test one more time and I wouldnt be surprised if it touches or even breaks a few cents under 51.00. Super simple play, I am bullish on a break of 56.25 with volume. Bullish TPs on a break of 56.25 are 60, 64, 67, 70, 75 and 80. There is also a substantial bearish possibility that we see a massive dip as the stock has consistently hit lower highs on the monthly chart and a drop to 45 seems likely on a break of support at 50.50. My bearish TPs in the event of such a dip are equally as far out at 48, 45, 42, 40, 35 and 30. Places to watch for a reversal on a large dip are 47.50, 42.50 and 40. Link to monthly chart attached (Multi Week Plan)

good base here LVS is at the bottom of a channel and bounced pretty well off a CNBC pump
I think it can go up a lot higher to at least the top of the channel
if it breaks out target is $60
keep short term trades short term

LVS at support Las Vegas Sands has reached its weekly support line, good potential for a solid re open play. Hidden bullish divergence printing on the weekly, and bullish divergence printing on the lower timeframes such as the 4 hr. Good place to take a long. Target $70+

LVS Long IdeaLVS has been in a consolidation range for over 3 months. It is approaching a trend line that has been proven to be major support over the past year. I am looking for a breakout of this trading range to the upside. This stock moves fast when it gets a little momentum to the upside. It is currently trading below the 200 day MA, which in this market makes it somewhat of a value play.
Strategy:
Jan 2022 60 Calls (These contracts are trading with the lowest premium since they were originated)
Aug 2021 52.50/50 Put Credit Spread. Good risk to reward if it bounces and, gives plenty of time for the move to happen and collect a little theta decay.
Good luck trading!

LVS - Back in the Trading ZoneLVS
ENTRY = 53-55
Cost Avg Down = 48
1st Target = 58
2nd Target = 62
HODL Target = 68+
______________________________________________________________________________________________________________________
This content is for informational, educational and entertainment purposes only. This is not in any way, shape or form financial or trading advice.
Good luck, happy trading and stay chill,
2degreez


