MCD Approaching Support, Potential Bounce!MCD is approaching support at 176.71 (61.8% Fibonacci extension, 61.8% Fiboancci retracement, horizontal swing low support) where it could potentially bounce to its resistance at 185.15.
Stochastic (89, 5, 3) is also approaching support where a corresponding bounce could occur.
MCD trade ideas

MCD Approaching Support, Potential Bounce!MCD approaching support at 178.88 (100% Fibonacci extension, 50% Fiboancci retracement, horizontal swing low support) where it could potentially bounce to its resistance at 185.08.
Stochastic (55, 5, 3) is also approaching support where a corresponding bounce could occur.


Macdonald's Short 2019Heading there to get lunch this second, just looking at charts and this looks like it is at or very near a top.
Monthly chart with an idea of what could happen.
Monthly Divergence, even a pull back to the top at $150ish is a good gain when leverged.

Christmas Eve shopping; MCDMarket is down on this half day and doing some bargain shopping of quality stocks. Aiming to take it back up to retest the high for Q1 2019 with March single Calls. NYSE:MCD

MCD can e down till $170.Tren may move down from 61.6% fibo. If price cant hit previous days high, it may faal till 170$.

SHORT $MCD - Sell OpportunitySymbol: AUDCAD
Prediction : Short
Daily : The trend change, with an Head and Shoulders at the top, now we test the resistance.
4H: The price pullback to 61.8%, the price reject this level, and give a bearish pattern.
1H: I think it's the time for the price to go down now, the price is on this channel, when it will break it will have space to fall .

MCD: Strong Support to Make Selling Short DifficultMCD stock is very popular with the retail trading groups. The footprint of the retail trader systems trading the stock is very obvious on this chart. The candlestick patterns are all indecisive, there are no strong easy runs in either direction, and lots of wicks and tails, which is where retail brokers are reaping huge profits. Overall, it is a very messy looking chart which makes for tough swing trading in general.
Apparently some retail system has targeted MCD for selling short. But alas, it seems the system doesn’t read charts very well. The support level is strong from the 2018 sideways trading range and it will be a huge challenge to sell short into this support level. Just one fine example of why retail systems that rely on software to finds stocks to trade don’t work. They are not nearly sophisticated enough.

$MCD - Sell opportunitySymbol: $MCD
Prediction : Short
Daily : The price break the last lower low, with a bearish run, it breaks the trendline, now it's time for a pullback.
4H: The price breaks the EMA 50, it start to consolidate on a support.
1H: I wait a pullback to come near the 61.8% zone and the last support which is now a resistance.


MCD Diamond Top?Lots of stocks bottoming out, need to look for stocks with room to drop. MCD looks like it's formed a diamond top, expect it to give up some gains.


MCD: a castle built on sandThis stretched run-up see very light volume following up. A retrace could bring us back to 176ish or even 166ish level. A breakdown of the 184ish level is to be observed.

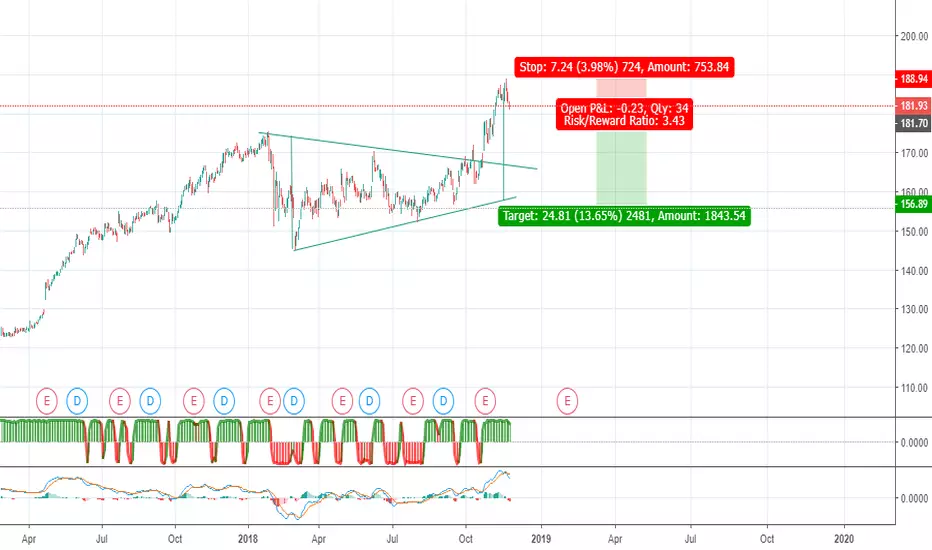
Mcdonald, weekly chart, time to get in, 380 % profit potential !From closer look, 1 day chart, head and shoulders pattern is forming.
On weekly chart we can see possible elliot waves, long term (more than a year target 230), short term target 180.
observe the news, but I doubt that company as old as mcdonald can shut down, it is much older than facebook though :D.
Good luck
Learning don't invest.


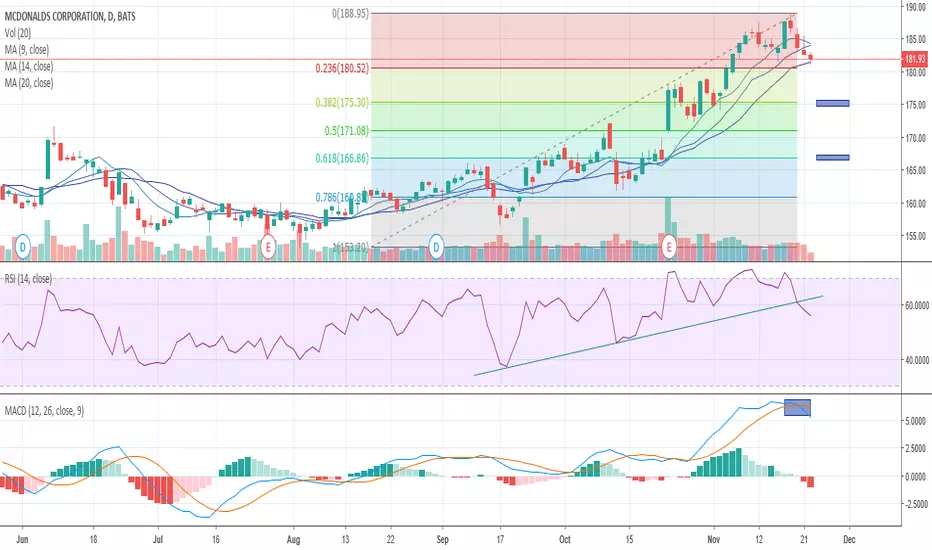
$MCD Short Term Outlook Not many bullish scenarios in blue chips out there.
MCD broken RSI trendline
MACD crossover
MAs on the verge of crossover
Bullish scenario=Retracement to 175 area
Bearish scenario=Retracement to 167 area
SICK sector rotations to defensive stocks for US stock market!I posted so much less stock ideas this quarter as generally I like to long stock that I'm willing to invest, and look for bullish set-ups.
While even I'm still bullish in so many names, but there aren't so many bullish set-ups in this market.
Wait a minute, defensive stocks are big exceptions and perfect choice for bottom-up strategy recently, and it's more than reasonable!
KO
PG
MCD
YUM
COST
and other classic defensive names like VZ, JNJ, MRK, PEP all showed great relative strength than the market!
(T is the lagger though)
That is, P/E ratio for tech stocks encounters huge corrections and the money come out of them just ran into these defensive stocks.
U.S stock market is still the top choice as there aren't many better alternatives.
While, investors tend to turn money into defensive stocks to fight for fluctuations.
In conclusion, it's still far from a financial crisis and it's still not too late to look for long opportunities in this sector!
Let's see how it goes!

The McRib is back! I'm sure that's why we're up almost 30% on the year.
It's not like they invented some new piece of technology I mean come on.
Not done with my defensive name hunt.

MCD Correction MACD bearish divergence, About to cross down. Also, MCD is correcting from its yearly high. I'd buy Put for December

MCD - LONG - after AccumulationMCD - after accumulation
waited for LPS (LPS its not a stock, its a Phase at WYCOFF Analyses) above ressitance, stronger than market
Entry at 181.09
stock now at 185.95 so stop at break even without Taking any profit
try to see where the stock can go
will calculate Profit Target and will load it :)
