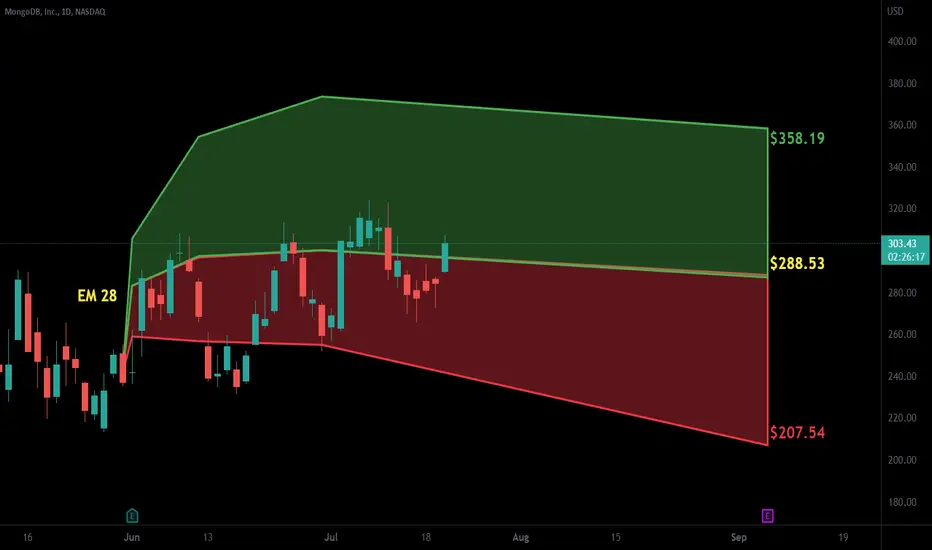
MDB trade ideas
MonoDB USASun Storm Investment Trading Desk & NexGen Wealth Management Service Present's: SSITD & NexGen Portfolio of the Week Series
Focus: Worldwide
By Sun Storm Investment Research & NexGen Wealth Management Service
A Profit & Solutions Strategy & Research
Trading | Investment | Stocks | ETF | Mutual Funds | Crypto | Bonds | Options | Dividend | Futures |
USA | Canada | UK | Germany | France | Italy | Rest of Europe | Mexico | India
Disclaimer: Sun Storm Investment and NexGen are not registered financial advisors, so please do your own research before trading & investing anything. This is information is for only research purposes not for actual trading & investing decision.
#debadipb #profitsolutions
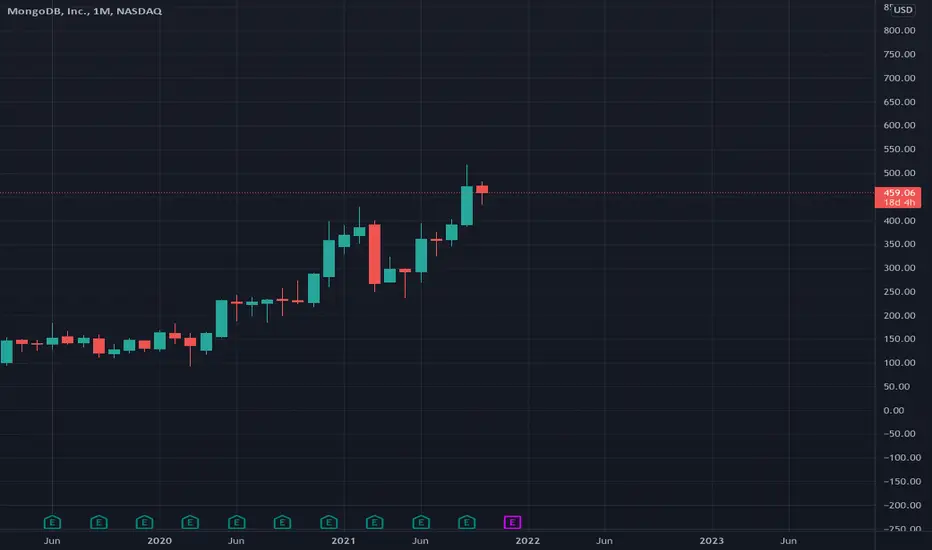
MDB MongoDB revenue increased 50% YoYMongoDB's fiscal third-quarter revenue increased 50% year over year.
Revenue growth rate increasing from 39% growth in the first quarter of fiscal 2022 to 44% in fiscal Q2 and now 50% in fiscal Q3.
MongoDB's 50% revenue growth put total revenue for fiscal Q3 at $227 million.
This was far beyond analysts' average forecast for revenue of $205 million during the period. (fool.com)
With this growth rate and cloud-based database needed for the upcoming metaverses, i think MDB MongoDB can reach all time high by the end of the year.
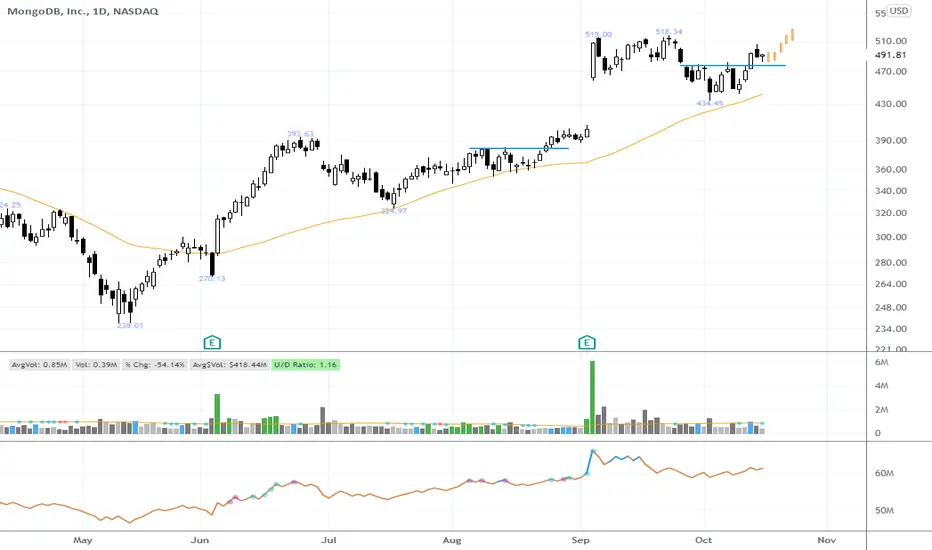
NASDAQ:MDB Potential short opportunityHi Guys , Here is my analysis on MDB
what im seeing here is a rising wedge pattern , which is telling us the buyer is slowing down ,
volume of buying is decreasing then as we can see there is a multiple wicks rejection on the resistance above ,
and it shows price failed to break above 517-520 ,
what im waiting for right now is ,
to wait price to break below 500 then we can look for our short position ,
let me know what you think about my analysis ,
Give it a thumbs up or comment if you like this idea !
$MDB Cup with Handle Re-Test$MDB has been a strong stock and looks to have formed a bit of deep cup w/handle formation. After it's break of the handle down trend it looks like it may be resting or re-testing that beak-out area. I have made notes on the chart of things that are important to me. The real proper entry is when it breaks above the high of the cup formation. I like early entries but missed this one. It looks to be setting up again. Ideally, I'd like this to pullback in to test the lows of the handle, maybe even undercut then start it's move back up. Alternately, if it can move over the short term down trend line with some volume I'm also interested in the trade. It is currently above all moving averages which is bullish to me. I bring it to your attention because I have put it on my watch list and you may like it too. Ideas, not investing / trading advice. We have about 25 days until earnings. Please confirm this on your own.
From earningswhispers.com:
Mongodb Inc Cl A Beats
Mongodb Inc Cl A (MDB) reported a 1st Quarter April 2021 loss of $0.25 per share on revenue of $181.6 million. The consensus estimate was a loss of $0.37 per share on revenue of $170.0 million. The Earnings Whisper number was for a loss of $0.30 per share. Revenue grew 39.4% on a year-over-year basis.
The company said it expects a second quarter non-GAAP loss of $0.43 to $0.40 per share on revenue of $180.0 million to $183.0 million. The current consensus estimate is a loss of $0.33 per share on revenue of $181.01 million for the quarter ending July 31, 2021. The company said it expects fiscal a 2022 non-GAAP loss of $1.38 to $1.25 per share on revenue of $771.0 million to $784.0 million. The company's previous guidance was a loss of $1.55 to $1.39 per share on revenue of $745.0 million to $765.0 million and the current consensus estimate is a loss of $1.43 per share on revenue of $764.65 million for the year ending January 31, 2022.
Bull FlagThere is also an inverse head and shoulders at the bottom but has broken neckline which can now serve as support.
Golden cross noted as well. A golden cross occurs when a faster-moving average crosses a slower moving average. Typically the 50 and the 200 DMA (daily moving average) are used. The death cross is opposite and would be when the 50 crosses down and through the 200.
A bull flag is a continuation pattern that occurs as a brief pause in the trend following a strong price move higher. The bull flag chart pattern looks like a downward sloping channel/rectangle denoted by two parallel trendlines against the preceding trend. During this period of consolidation, volume should decrease or flatten out through its formation and resolve to push higher on the breakout. The actual price formation of the bull flag resembles that of a flag on a pole hence its namesake. I do not see a large volume bar at point where the flag resistance line (top trendline) was broken, however there is a large volume bar at the right shoulder of the Inverse H&S pattern.
The pole has to be long enough to support the weight of the flag or it will fall over )o: In other words a flag can not stay in the down channel for eons as it will become too heavy for the pole. If the retracement becomes deeper than 50%, it may not be a flag pattern so take another look. Ideally, the retracement (pull back) ends at or less than 38% of the original trend up.
Both the bear (appears after a steep move down) and bull flag (appears after a steep move up) chart patterns measure the target price as a projection using the length of the flagpole. I take the pole using the magnet and move it to the bottom trendline of the flag. I have seen folks project targets differently though.
Negative volume is very high. Short percent is over 9% with a bit over 7 days to cover. This is not a value stock! Revenue is growing a lot quarterly but EPS is still negative. Market cap is 28.2 billion. I am looking at the patterns and patterns do fail.
No recommendation.
The market is rarely rational. Price can move in ways that cause the maximum amount of pain the maximum amount of people )o:
US Stock In Play: $MDB (MongoDB Inc)$MDB broken out of a double bottom chart pattern from $325, general trend resumption price action behavior, rallying +17.36% within a week. $MDB is currently close at $380, its 3 months high.
With $MDB current implied volatility remaining 40% away from its peak of $26/day that was set in March 2021, $MDB remains in traction to recapture its all time high of $428 at its current price action momentum that is defying general market weaknesses.
$MDB provides general purpose database platform worldwide. The company offers MongoDB Enterprise Advanced, a commercial database server for enterprise customers to run in the cloud, on-premise, or in a hybrid environment; MongoDB Atlas, a hosted multi-cloud database-as-a-service solution; and Community Server, a free-to-download version of its database, which includes the functionality that developers need to get started with MongoDB. It also provides professional services, such as consulting and training.
$MDB bullish descending wedge breakout$MDB set to test much higher levels, $571 target.
Look to enter on dip above upper trend line breakout
Price action trading in a bullish descending wedge with resolution to the upside on breakout.
Now above 200 dma and MACD beginning to curl back up.
Trade could last several months and stop set with break below UTL of breakout.
MDB has work to doConsidered MDB to be in a spot of bother a little bit ago... it slipped but regained it's 200 day SMA - which is very good - however it's still got a fair bit of work to do. It's regained it's uptrend line from last spring but faces resistance zones and the downtrend line that's started all this to beat. This stock is still in quite a precarious position so proceeding with caution.