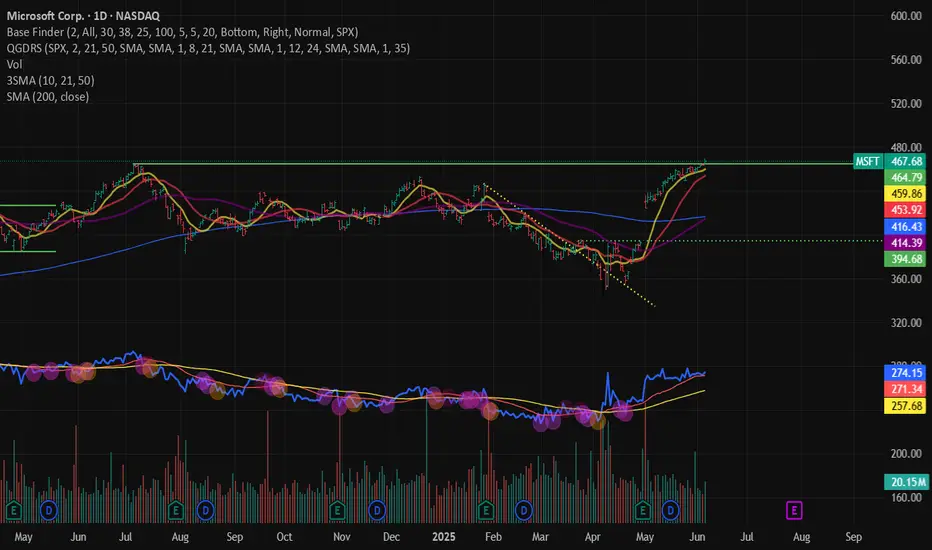
MSFT Surges to Record High, Sustaining Bullish MomentumMicrosoft (MSFT) has demonstrated remarkable resilience, fully recovering from losses incurred during the tariff war sell-off. The stock has even achieved a new all-time high. This performance underscores the stock’s persistent bullish trend. The low recorded on April 7, 2025 likely serves as a robust support level during future pullbacks. The rally from this low is unfolding as a classic five-wave impulse pattern, indicative of strong upward momentum, with wave (3) nearing completion.
From the April 7 low, wave (1) concluded at 394.65, followed by a pullback in wave (2) that bottomed at 355.67. Wave (3) has since extended higher, exhibiting its own internal impulse structure. Within wave (3), wave 1 peaked at 380.39, with wave 2 dipping to 375.19. The stock then surged in wave 3 to 459.58, followed by a wave 4 retracement ending at 448.91. A detailed 45-minute chart below highlights the final leg wave 5, which further subdivides into a lesser-degree impulse. From wave 4, wave ((i)) reached 463 and wave ((ii)) corrected to 454. Wave ((iii)) climbed to 473.43, and wave ((iv)) dipped to 466.96.
MSFT may experience a slight further upside to complete wave ((v)) of 5 of (3). However, a larger-degree pullback in wave (4) is anticipated soon, setting the stage for one final upward push to conclude the five-wave rally from the April 7 low. This structured advance reinforces Microsoft’s bullish outlook, with key support levels likely to hold firm.
MSFT trade ideas

Microsoft - This might be the ultimate breakout!Microsoft - NASDAQ:MSFT - will break the all time high:
(click chart above to see the in depth analysis👆🏻)
If you wonder why Microsoft has been rallying +15% this month, market structure will give you an answer. In fact, the recent bullish break and retest was totally expected, and if we take into account the recent quite strong bullish behaviour, an all time high breakout will follow soon.
Levels to watch: $450
Keep your long term vision!
Philip (BasicTrading)

MSFT 3d, Q2 2025 Microsoft painting a pattern that looks like a wyckoff distribution. Not 100%, but want to publish to keep an eye on it.

MSFT next target is $500 but....
#MSFT is currently in #overbought territory, which may cause the price to #temporarily decline to the $425–$445 range.
The chart indicates the price is moving between two #inner trendlines.
However, MSFT has broken out of the bearish trend ( ran out of the fear), with the next potential targets at $500 and, later, $600.

MSFT Weekly Options Play – 2025-06-09🧾 MSFT Weekly Options Play – 2025-06-09
Bias: Moderately Bearish
Timeframe: 5–6 days
Catalysts: Overbought RSI, weakening momentum, technical divergences
Trade Type: Single-leg put option
🧠 Model Summary Table
Model Direction Strike Entry Price Target Stop Loss Confidence
Grok Bearish 457.50P $0.76 $1.14 $0.19 65%
Claude Bearish 460.00P $1.03 $1.55 $0.72 70%
Gemini Bearish 457.50P $0.75 $1.20 $0.38 65%
DeepSeek Bearish 470.00P $3.65 $5.48 $2.56 70%
Llama Slightly Bullish 472.50C $3.15 $3.78 $2.83 68%
✅ Consensus: Short-term bearish trade setup
📉 Core Setup: Reversal from overbought with MACD divergence
⚠️ Outlier: Llama prefers bullish call due to longer-term trend strength
🔍 Technical & Sentiment Recap
Trend: Overextended rally, RSI (78.2) = overbought
Momentum: MACD shows bearish divergence on daily; 5-min weak
Sentiment: VIX ~16.7 = stable but cautious; mixed AI news & max pain at $460
Max Pain: $460 implies gravitational pull; current price may pull back
Volatility: Option premiums reflect narrow range, but directional edge favors downside
✅ Final Trade Recommendation
Parameter Value
Instrument MSFT
Strategy Single-leg PUT (weekly)
Strike $457.50
Entry Price $0.76 (ask)
Profit Target $1.22 (~60% gain)
Stop-Loss $0.38 (50% premium loss)
Size 1 contract
Entry Timing At market open
Confidence 65%
🎯 Rationale: Near-term exhaustion of upside, short-term technical reversal, and profit-taking setup with favorable risk/reward.
⚠️ Risk Checklist
Strong trend continuation could invalidate pullback thesis
Low VIX may reduce option gamma/velocity
Sector-wide positive catalyst (AI or rate cuts) can cause rapid rebound
Watch for closes above 10-EMA (~$461) to exit early if invalidated
📊 TRADE DETAILS SNAPSHOT
🎯 Instrument: MSFT
🔀 Direction: PUT (SHORT)
🎯 Strike: 457.50
💵 Entry Price: 0.76
🎯 Profit Target: 1.22
🛑 Stop Loss: 0.38
📅 Expiry: 2025-06-13
📏 Size: 1 contract
📈 Confidence: 65%
⏰ Entry Timing: open
🕒 Signal Time: 2025-06-09 01:44:06 EDT

MSFT weekly cup and handleMSFT staying strong during all of the volatility and chop shows relative strength would like to see the market push to all time highs with MSFT and some other mega caps leading the way this could pan out in time and looks like a great set up to test the highs reset and push higher. Not financial advice

$MSFT Getting HighNASDAQ:MSFT is getting to a price where its a good idea to start trimming and/or taking profits as we should always have a plan before trading. Happy Friday

MICROSOFT - Simple Analysis WIN ! Its Bearish Ahead ! MAGIC Microsoft - Lets explore the magic of Technical Analysis / Price action.
Microsoft is currently testing the daily resistance level and it will be more matured once the bearish candle / rejection candle is formed. We see a bearish divergence at this level which is a strong confluence for the bearish trend a head.
forgot to mention, a perfect bookish - Bearish Crab pattern is forming, which is a forming a Potential Reversal Zone (PRZ).
we expect our entry after confirmation on the break of HL - 447 level and then we can plan our TPs accordingly.
Please like and comment!

MSFT Pushes Into New Highs With Quiet StrengthMicrosoft ( NASDAQ:MSFT ) is breaking into all-time highs with tight, steady movement up the right side of the base. What stands out is how well it’s held up — even with recent market chop, there’s been no giveback, just clean progression.
This kind of action tends to reflect confident buying behind the scenes — no big spikes, just quiet control. The stock is firmly above all major moving averages and has been coiling near the highs without breaking structure.
From a fundamental angle, MSFT continues to impress:
AI dominance via Azure + OpenAI
Strong cloud growth and margin expansion
Reliable EPS growth, quarter after quarter
One of the few mega caps leading, not lagging, right now
Whether you’re tracking leadership, strength under pressure, or clean chart structure, it’s all lining up here.
Trade Setup:
📈 Entry: 464.80 – 478.68
🛑 Stop: 441.30 – 432.17
🎯 Target: 529.76 – 557.68
Will be watching for continuation through highs — or possibly a tight flag that gives a second entry window. In a market with fewer names standing tall, MSFT is acting like a leader.

MSFT Holding Highs. Gamma & Structure Say Rejection Risk is Real🔍 MSFT GEX Daily Overview (Options Sentiment Breakdown)
Microsoft ( NASDAQ:MSFT ) closed at $460.36, right inside a tight zone between heavy call resistance at 462.5–465 and a weakening support floor at 450. The stock has been on a strong run, but we’re now entering a dealer-dense gamma zone — which often creates price suppression or whipsaws.
GEX Sentiment Insights:
* 🟩 Call Walls stacked at 462.5 → 465 → 470, with major gamma hedging expected.
* 🟥 Moderate Put Wall @ 450 (–18.48%), with further protection near 447.5 HVL.
* ❄️ IVR at 7.1 → dirt cheap premiums = great for debit spreads or directional plays.
💡 Options Play (GEX Bias):
* Bullish Scenario: Break above 465, consider Jul 19 470c or 465c/475c spread — targeting 470–475 before next gamma wall.
* Bearish Scenario: If price loses 458, ride short to 450 with Jul 19 455p/445p vertical spread or naked 455p if volume confirms.
Gamma flip zone is tight. Bulls need momentum + volume to break through. Otherwise, dealer hedging could pin MSFT here all week.
📉 MSFT 1-Hour Price Structure (Swing/Intraday Gameplan)
On the hourly, MSFT is in a rising wedge structure, testing overhead supply around 463–468, while forming lower highs and building distribution signals.
Key Observations:
* 🔻 Price failed to hold above BOS zone near 463.
* 📦 Sitting inside CHoCH supply (red box), multiple rejection candles printing.
* ⚠️ Overbought readings across BBP & DPR (98%+), MACD softening — potential for pullback.
📈 Swing Trade Setup:
* Bullish: Only get long if MSFT reclaims and bases above 465. Target: 470–475. Stop: below 460.
* Bearish: Break below 458 = clean swing short toward 450–447.5. Stop: above 461.
📊 Intraday Plan:
* Scalp rejection at 462–463 for short → first target 458, extended 455.
* Long scalp off 455.3–456 demand zone if market supports tech bounce.
Volume and index context (SPY/QQQ) are critical — MSFT follows market rotation, so use confluence.
💭 Final Take
MSFT is now dancing at the top of a major gamma ceiling. Without fresh momentum or market-wide tech strength, this area favors fade setups. GEX data supports cautious upside while rewarding early downside setups with clean risk-reward.
⚠️ Disclaimer:
This analysis is for educational purposes only and not financial advice. Always do your own due diligence and manage risk properly before trading.

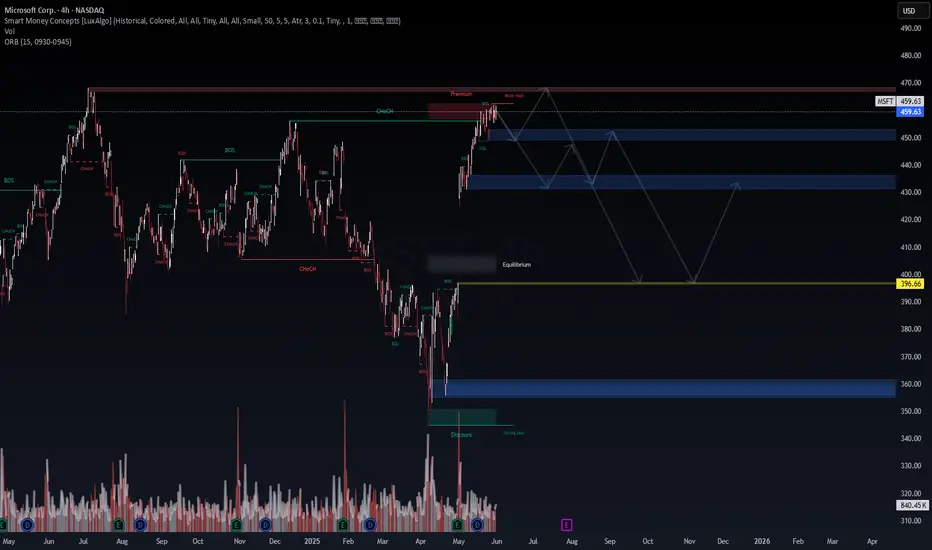
Microsoft Corp. (MSFT) – Smart Money Concepts | Liquidity Trap This chart outlines a high-probability liquidity run reversal setup driven by SMC principles. Price has reached Premium territory, sweeping the weak high and now showing signs of distribution.
🔍 Key Levels & Structure:
Current Price: $459.63
Premium Zone: $457–462 → Price swept weak high (liquidity engineered)
Break of Structure (BOS): Seen post-CHoCH, signaling bearish shift
Equilibrium Target: $396.66 (macro midpoint)
Discount Refill Zone: $355–365 (previous accumulation base)
📊 Strategy & Setup:
Wait for confirmation of BOS below $450
First Re-entry Opportunity: $445–448 supply zone retest
Second Re-entry: $432–435 mitigation block
Final Buy Zone: $355–365 if deeper liquidity grab unfolds
Final Target (Mean Reversion): $396.66
🔄 Institutional Flow Logic:
Smart Money likely induced breakout liquidity above weak high.
Now expecting distribution and redistribution cycles on the way to equilibrium.
Ideal setup for swing traders or position traders aligning with SMC framework.
📌 If the market fails to hold above $462, this could trigger a cascade of BOS levels and internal breakouts all the way back to the discount zone.
#MSFT #SmartMoneyConcepts #SMC #LiquiditySweep #OrderBlocks #BreakOfStructure #TradingStrategy #WaverVanir #Equilibrium #MarketStructure #TradingView
MSFT short, Broader Market Weakening.Weekly:
MFI divergence: Smart money flow pulling back while price pushes up — early warning sign of distribution.
Price touching upper Bollinger Band: Extended move on volatility basis; usually implies reversion risk, especially if paired with divergence.
Daily:
Overbought RSI: Price momentum overstretched.
RSI Bearish Divergence: Momentum slowing while price makes new highs — classic reversal signal.
MACD Bearish Crossover: Bearish momentum shift confirmed.
Volume Divergence: Lower volume on recent up moves or spike on down bars — lack of conviction on the rally.
✅ Multiple uncorrelated indicators (momentum, volatility, volume, price action) pointing to a short-term reversal.
✅ Higher time frame (weekly) divergences + Daily confirmations — that’s powerful confluence.

Microsoft Wave Analysis – 29 May 2025
- Microsoft reversed from resistance zone
- Likely to fall to support level 447.00
Microsoft recently reversed down from the resistance zone located between the resistance levels 465.00 (which stopped the weekly uptrend in 2024) and 455.00 (top of wave (B) from the end of 2024).
This resistance zone was further strengthened by the upper weekly and daily Bollinger Bands.
Given the strength of the aforementioned resistance zone and the overbought daily Stochastic, Microsoft can be expected to fall to the next support level 447.00.

Microsoft’s Market Puzzle — The X2 ConundrumAfter a corrective decline from Microsoft’s All-Time High at $467.70, we’ve been tracking a potential complex structure unfolding — and the recent price behavior fits right into a well-formed W–X–Y–X–Z pattern .
In this latest move, we may be witnessing the final stages of the second X-wave (X2) — a sharp and extended rally that reached $462.52, pushing marginally above the first X-wave at $456.16.
Now before that raises eyebrows — yes, X2 is allowed to extend above X1 . In a complex correction, X-waves are connectors, not trends. They can retrace deeply or even overshoot previous pivot highs — especially in the form of an expanded zigzag or running correction. It’s rare, but perfectly legal in Elliott’s chaotic universe.
But this leads to a question:
Is this rally impulsive… or is it bait?
If the move from $344.79 is truly impulsive, then we’re potentially mid-way through a new bullish leg — with wave 3 ending at $462.78, and a mild wave 4 correction into the $437–$421 zone (0.236–0.382 retracement) expected before another pop higher. This view only holds as long as price remains below the ATH at $467.70 — our immediate invalidation level .
However, momentum indicators raise suspicions:
RSI is showing a clear bearish divergence — price made a new high, but RSI didn’t confirm it.
MACD has started rolling over, with a fading histogram — signaling potential exhaustion in this move.
This sets the stage for an alternate, and perhaps more compelling, scenario:
The rally from $344.79 to $462.78 is not a new trend — it’s the X2 wave in a still- unfinished W–X–Y–X–Z combo correction .
If this is the case, then what comes next is Wave Z — the final leg down to complete the entire corrective structure.
And here’s the Elliott rulebook:
Wave Z must be a 3-wave structure (likely a zigzag)
It often mirrors the size of Wave Y or contracts modestly
Projection for Z from the X2 top targets the $393–$351 zone, which represents a 0.618–1.0 retracement of the Wave Y decline
This zone becomes the primary downside watch area, should price reject from this level and fail to break above $467.70.
Summary:
We’re at a critical junction.
The rally from $344.79 could either be:
An impulsive move needing a wave 4 pullback
Or a complex X2 wave — ready to hand over the baton to Wave Z
Both scenarios require careful tracking of structure, MACD, RSI, and price action near the retracement zone and the ATH invalidation level.

MSFT Breaking out? 4 Things Need to be Fixed FirstIn the last 2 weeks, MSFT broke above 2 major pivot levels $448 and $455 – that’s just 4 weeks after hitting a 52-week low on April 7th
Some would say that this represents huge momentum – and that the stock is ready for a major breakout above all-time high level and fly above $470
I have 4 issues with that view – that I need the stock to go through first and “prove itself” – let’s take a look at them quickly
1. Daily Shows Exhaustion: The last few daily bars are not reflecting confidence in the price moves – they reflect exhaustion – that’s almost all last week – the price struggled to close at the day’s high.
2. Missing the Right Alignment: The 50SMA is still below the 100SMA – that shows the bulls will still need a “breather” to consolidate their efforts and the key SMAs to align properly. In the daily view we also see how extended the price is (look at the purple line 20SMA wrt the other MA's)
3. Over-bought Weekly: The weekly chart shows the stock as over-bought, supporting the view that some profit taking and consolidation need to happen first before a serious breakout to new highs
4. Unsupportive Market: The market is still not recovered – we’re still in “daily-news-jumpy-sensitive” mode – there are even opinions that we’re in a bear market rally. Then some large money are waiting to see the outcome of tariffs and other decisions that will have lagging impact in June & July .. for me this is the most critical factor.
MSFT continues to be one of the best plays out there, so as we build up the position in our portfolio, let’s keep an eye on these factors and await setups with higher probabilities.
As usual, this is not a trading recommendation - just my own quick analysis
- please feel free to share your thoughts.

MICROSOFT Correction ahead of 1st 1D Golden Cross in 2 years?Microsoft (MSFT) is just below the $470 All Time High (ATH) and last technical Resistance, following the remarkable rally on the April 07 2025 bottom.
By the first week of June, it should technically form a 1D Golden Cross, which will be its first in more than 2 years (since March 17 2025). That Golden Cross was formed just after the price pulled-back on the 0.382 - 0.5 Fibonacci retracement Zone, finding support on its 1D MA50 (blue trend-line) and rebounding.
As a result, it is quite possible to see a short-term correction to at least $420 before the 1D Golden Cross restores the bullish sentiment. That previous structure eventually hit the -1.0 Fibonacci extension, before the next 1D MA50 test. We therefore expect to see $630 in 2025 before a 1D MA50 correction again.
-------------------------------------------------------------------------------
** Please LIKE 👍, FOLLOW ✅, SHARE 🙌 and COMMENT ✍ if you enjoy this idea! Also share your ideas and charts in the comments section below! This is best way to keep it relevant, support us, keep the content here free and allow the idea to reach as many people as possible. **
-------------------------------------------------------------------------------
💸💸💸💸💸💸
👇 👇 👇 👇 👇 👇

What Is Stock Tape Reading, and How Do Traders Use It?What Is Stock Tape Reading, and How Do Traders Use It?
Tape reading is a real-time market analysis method used to track buying and selling pressure. Unlike technical indicators, which rely on historical data, tape reading focuses on executed trades, order flow, and liquidity shifts. Traders use it to assess momentum, identify institutional activity, and refine trade timing. This article explores how tape reading works, its role in modern markets, and how traders apply it to short-term decision-making.
The Origins and Evolution of Tape Reading
Tape reading began in the late 19th century when stock prices were transmitted via ticker tape machines, printing a continuous stream of price updates on paper strips. Traders would gather around these machines, scanning for large trades and unusual activity to anticipate market moves. One of the earliest and most well-known tape readers, Jesse Livermore, built his fortune by studying these price changes and spotting institutional buying and selling patterns.
By the mid-20th century, as markets became faster and more complex, ticker tape machines were replaced by electronic order books. Instead of scanning printed numbers, traders began using Level 2 market data and time & sales windows to track order flow in real time. This transition allowed for more precise liquidity analysis, making it easier to see how large orders impacted price movement.
The rise of algorithmic and high-frequency trading (HFT) in the 2000s further changed the landscape. Today, market depth tools, order flow software, and footprint charts have replaced traditional tape reading, but the core principle remains the same: analysing how buyers and sellers interact in real time. While charts and indicators offer historical insight, tape reading provides a direct window into current market behaviour, giving traders an edge in fast-moving conditions.
How to Read the Tape
Nowadays, tape reading is all about real-time market data—watching when and how orders are placed and filled to gauge momentum and liquidity. Unlike technical indicators, reflecting past price action, tape reading focuses on what’s happening right now. Stock, forex, and commodity traders use it to assess buying and selling pressure, spot large orders, and understand market sentiment as it unfolds. Here is the key information provided by tape reading:
Time & Sales
The time & sales window (the tape) displays every completed trade. Each entry shows time, price, trade size, and whether it hit the bid or ask.
- Trades at the ask suggest aggressive buying, as buyers are willing to pay the market price.
- Trades at the bid indicate selling pressure, as sellers accept lower prices.
- Large block trades often signal institutional activity—tracking these can reveal where big players are positioning.
Bid-Ask Activity
Nowadays, an order book is a part of tape reading. The order book (Level 2 or DOM) shows the number of buy and sell orders at different price levels. While not all orders get filled, traders watch for:
- Stacked bids (a high concentration of buy orders) near a price level, which may indicate strong buying interest.
- Stacked offers (large sell orders) acting as resistance.
- Orders rapidly appearing or disappearing, suggesting hidden liquidity or fake orders meant to mislead traders.
Volume and Trade Size
Changes in trade size and volume help traders judge the conviction behind a move:
- Consistent large trades in one direction can suggest institutions accumulating or distributing a position.
- A surge in small trades may indicate retail participation rather than institutional moves.
- A sudden drop in trade activity after a sharp move may hint at exhaustion or a potential reversal.
Trade Speed
The pace of executions matters.
- Fast, continuous transactions suggest urgency—buyers or sellers are aggressively taking liquidity.
- A slowdown in transactions near a key level can indicate hesitation or a shift in sentiment.
Tape Reading vs Technical & Fundamental Analysis
Tape reading differs from technical and fundamental analysis in both approach and timeframe. While technical traders study historical price patterns and fundamental analysts focus on company performance and economic data, tape readers focus on real-time order flow to assess market direction as it develops.
Technical Analysis
Technical traders rely on chart patterns, moving averages, and oscillators to identify trends and potential turning points. These tools are built on past price data, meaning they lag behind actual market activity. For example, a trader using a moving average crossover strategy waits for confirmation before acting, whereas a tape reader sees momentum shifting as it happens by watching the flow of orders.
Fundamental Analysis
Fundamental analysis is longer-term, based on financial statements, earnings reports, and macroeconomic indicators. Investors using this approach focus on factors like revenue growth, interest rates, and industry trends to decide whether a stock is undervalued or overvalued. Tape reading, by contrast, ignores these metrics entirely—it’s used by short-term traders reacting to immediate buying and selling pressure.
Where Tape Reading Fits In
Many traders combine approaches. A day trader might use technical analysis to find key price levels and then apply tape reading to fine-tune entries and exits. Similarly, a swing trader tracking earnings reports may use tape reading to see how large players are reacting. Each method provides different insights, but tape reading offers a unique advantage: it reveals market sentiment in real time, helping traders assess momentum before price movements become obvious.
Advantages and Disadvantages of Tape Reading
Tape reading gives traders an inside look at real-time market activity, but it also comes with challenges, especially in modern electronic markets.
Advantages
- Immediate Market Insight: Unlike lagging indicators, tape reading reflects live buying and selling pressure, helping traders react before price changes become obvious.
- Identifying Large Buyers & Sellers: Institutions often execute orders in patterns, leaving clues in the stock market tape. Recognising these can help traders gauge potential price direction.
- Fine-Tuning Entries & Exits: By tracking order flow near key price levels, traders can time their trades more precisely rather than relying on static chart signals.
- Useful in Fast-Moving Markets: Tape reading can be particularly valuable in scalping and day trading, where short-term momentum plays a key role.
Disadvantages
- Algorithmic Trading Distortion: High-frequency trading firms place and cancel orders rapidly, making it harder to interpret true supply and demand.
- Steep Learning Curve: Unlike technical analysis, which provides visual patterns, tape reading requires experience in spotting meaningful order flow changes.
- Mentally Demanding: Constantly watching the tape can be exhausting, requiring a high level of focus and quick decision-making.
- Less Effective in Low-Volume Markets: When liquidity is thin, tape reading becomes unreliable, as fewer trades mean less actionable data.
Modern Footprint Charts and Order Flow Software
While some stock tape readers rely on raw order flow data, many use footprint charts and order flow software to visualise buying and selling pressure more effectively.
Footprint charts display executed trades within each price bar, showing volume distribution, bid-ask imbalances, and point of control (POC)—the price level with the highest traded volume. This helps traders see where liquidity is concentrated and whether buyers or sellers are in control.
Order flow software offers heatmaps, cumulative delta, and volume profile tools. Heatmaps highlight resting liquidity in the order book, revealing where large players may be positioned. Cumulative delta tracks the difference between market buys and sells, helping traders assess momentum shifts.
These tools provide a more structured approach to tape reading, filtering out noise and making it easier to spot large orders, absorption, and potential reversals. While experience is still essential, modern software gives traders a clearer view of market behaviour beyond just raw time & sales data.
The Bottom Line
Reading the tape remains a valuable tool for traders looking to analyse real-time order flow and market liquidity. While there are numerous algorithms that place trades, understanding executed trades and bid-ask dynamics can provide an edge in fast-moving conditions.
FAQ
Is Tape Reading Still Useful in Trading?
Yes, but the application of tape reading in trading has changed. While traditional tape reading focuses on printed ticker tape, modern traders use time & sales data, Level 2 order books, and footprint charts to analyse order flow. High-frequency trading and algorithmic activity have made tape reading more complex, but it remains valuable for scalpers, day traders, and those tracking institutional activity.
What Are the Principles of Tape Reading?
Tape trading is based on real-time order flow analysis. Traders focus on executed trades (time & sales), bid-ask activity (order book), volume shifts, and trade speed to gauge buying and selling pressure. The goal is to understand how liquidity moves in the market and spot signs of institutional accumulation or distribution.
What Is the Difference Between Order Book and Tape?
The order book (Level 2 or DOM) shows pending orders at different price levels, representing liquidity that may or may not get filled. The tape (time & sales) displays completed transactions, showing actual buying and selling activity in real time.
What Is the Difference Between Technical Analysis and Tape Reading?
Technical analysis relies on historical price patterns and indicators, while tape reading focuses on real-time executed trades and market depth. Technical traders look at charts, whereas tape readers analyse live order flow to assess momentum and liquidity shifts.
How to Read Ticker Tape?
Modern ticker tape is displayed in time & sales windows on trading platforms. Traders monitor price, trade size, and whether transactions occur at the bid or ask. Rapid buying at the ask suggests demand, while consistent selling at the bid indicates selling pressure.
This article represents the opinion of the Companies operating under the FXOpen brand only. It is not to be construed as an offer, solicitation, or recommendation with respect to products and services provided by the Companies operating under the FXOpen brand, nor is it to be considered financial advice.

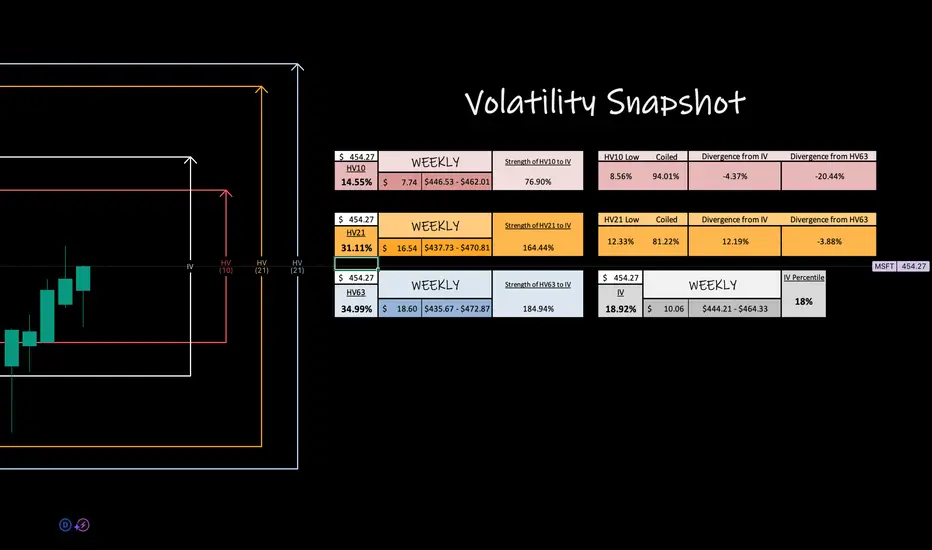
Microsoft, Inc -- Weekly PotentialVolatility, expressed through standard deviation, quantifies market elasticity and presents a level of probability and precision that humbles us all.
I wanted to take a look at at least one of the magnificent 7s with the community this weekend, so I decided on NASDAQ:MSFT because it had the lowest IV of them all.
Lowest IV = best premium value, right? Well it can, but it can also be leading onto more consolidation especially after a big move up like NASDAQ:MSFT has recently done.
Here, we see that HV21 has just come out of it's regression to quarterly means and now is consolidating lower with bi-weekly coiling towards it's yearly lows.
See what I'm doing? Ill be watching for HV21 dropping and HV10 bottoming..there we will find our volatility bounce again. Some of the coolest magic happens when HV10 is at lows at does the HUGE swing back up to quarterly means. SO STAY TUNED!!
BOOST the post, drop a follow and comment, BUT don't forget to circle back at the end of the week to revisit and observe how our trending markets preformed!
MSFT - PULLBACK BUT WILL IT HOLDGood Morning,
MSFT had an amazing performance the last several weeks. We are now in a corrective wave with MSFT. This could prove good support and hold for another powerful wave or it could tumble into the gap it created earlier on in the trend. This will take a close eye to make sure your trade stays on track.
Two perspectives gives you the opportunity to assess your risk and where you may want to TP and re-enter a new trade.
ENJOY!

TSLA, META, MSFT, PLTR Daily Trade SetupsIn this update we review the recent price action in Tesla, Microsoft, Meta and Palantir and identify the next high-probability trading setups and price targets. To review today's video analysis, click here!

$MSFTNASDAQ:MSFT still holding strong around $430.
Even with tech moving fast and competition rising, Microsoft remains solid in key sectors.
👀 Buyers aren’t letting go demand is steady.
Don’t sleep on this one.
#MSFT #TechStock

What Fuels Microsoft's Unstoppable Rise?Microsoft Corporation consistently demonstrates its market leadership, evidenced by its substantial valuation and strategic maneuvers in the artificial intelligence sector. The company's proactive approach to AI, particularly through its Azure cloud platform, positions it as a central hub for innovation. Azure now hosts a diverse array of leading AI models, including xAI’s Grok, alongside offerings from OpenAI and other industry players. This inclusive strategy, driven by CEO Satya Nadella's vision, aims to establish Azure as the definitive platform for emerging AI technologies, offering robust Service Level Agreements and direct billing for hosted models.
Microsoft's AI integration extends deeply into its product ecosystem, significantly enhancing enterprise productivity and developer capabilities. GitHub's new AI coding agent streamlines software development by automating routine tasks, allowing programmers to focus on complex challenges. Furthermore, Microsoft Dataverse is evolving into a powerful, secure platform for AI agents, leveraging features like prompt columns and the Model Context Protocol (MCP) server to transform structured data into dynamic, queryable knowledge. The seamless integration of Dynamics 365 data within Microsoft 365 Copilot further unifies business intelligence, enabling users to access comprehensive insights without switching contexts.
Beyond its core software offerings, Microsoft's Azure cloud provides critical infrastructure for transformative projects in highly regulated sectors. The UK's Met Office, for instance, successfully transitioned its supercomputing operations to Azure, improving weather forecasting accuracy and advancing climate research. Similarly, Finnish startup Gosta Labs utilizes Azure's secure and compliant environment to develop AI solutions that automate patient record-keeping, significantly reducing administrative burdens in healthcare. These strategic partnerships and technological advancements underscore Microsoft's foundational role in driving innovation across diverse industries, cementing its position as a dominant force in the global technology landscape.
