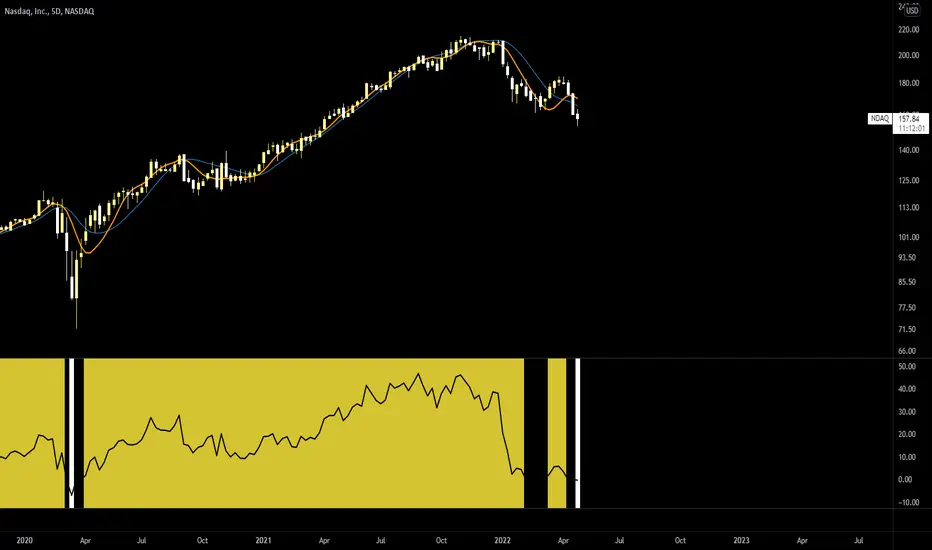
W PATTERN/If Long Be SafeW pattern noted.
This is possibly the last leg of a bearish bat but it has only reached the .786 versus the .886 so far.
This pattern may not be complete as there may be a push up to the .886.
Candle of indecision today at the .786 fib level of XA. The impulse wave of this pattern is labeled XA and is to the downside, which often indicates a bearish pattern that is known to reverse when the final leg terminates at D. The final leg has possibly not reached D yet. The alternate bat terminates at the 1.113 which is also a possibility if this passes the .886.
No recommendation/Any pattern can fail.
NDAQ trade ideas


In the past 10 years this is a good time to buyThe 30 moving average on this weekly chart has always been a very important support. Will it be this time too? We are at the beginning of the corporate earnings season, the job market looks strong and the Fed has taken a decisive direction. I cannot know if it is the beginning of a rise (have the lows of the decade been marked?) Or it will be just a rebound. We are watching

Nasdaq bottom will be Q3 2023 at 100 PtThis is my analysis to understand where the bottom could be for the Nasdaq.
Between 100 and 140

Bottom will be hit Q2 2024Just a crazy idea that came up in my mind watching and analyzing VIX and SPX.
In this way, I see that a possible bottom with a possible change in the VIX uptrend started in 2018 can find its way down around the Q2 of 2024, and it makes sense if we think we are entering the recession now.
My bottoms are:
SPX 3000 - 3500
NDAQ 100 - 140

NASDAQ Inc. | taking positionI am taking a position in NASDAQ Inc.
Prediction is increase in stock price

NADAQ touches 105.NADAQ is going to touch 105 but, there is another support zone that said maybe be touched and that's blue line drawn.
So if 105 break down it would go down to 80!!!!

Feeling Bearish on NASDAQGood Day to The Investing World
Despite the research and judgment being quite close and difficult, I am feeling bearish on NASDAQ for the next half-year. The main reason supporting this is the US Economy, which is not in a good position at this time and date. Another reason for this is because of the trend, which is just about identified as a downtrend, despite the Bull Bear Power graph showing us an uptrend. NASDAQ wont fall forever, and it may recover its value after the next few months this year. But see the graph for yourself, incase you might think differently.

NDAQ BUYJust testing new a Data Feed - Strong Bulls for tomorrow - In Total 900 Shares @ 142 - let's see if that works or not.

Bubble of all bubble. NASDAQ to $10. You're welcome.My long term forecast is that the Feds will NOT stop raising interest rates until the US Dollar becomes a deflationary asset and reclaiming its once mighty purchasing power since its inception in 1913. Also, I strongly believe that the Feds will continue quantitative easing until all 9T of its balance sheet is rolled off. I project that the Feds will continue to remain hawkish until 2035, when these goals are achieved and the US Dollar is mighty as ever. Hence I am very adament that we will see a decade long bear market and recession where the NASDAQ will truly not bottom until 2035. Until then, I will remain FULLY bullish on DXY US Dollar! #cashisking #greenback #usdollar

NQ/ Nasdaq bear market Nasdaq continuation to the downside / I do believe this isn’t over and we will see ( 344$ on the SPY ) this is just a market awareness idea as you see my thoughts are down period .3-4 months then dollar cost average into the stocks you like for the next 5-15 years plus imo - including crypto

$NDAQ ♡ NASDAQ INC. ♡ +26.25%My trading plan consists of collecting 5 confirmations MINIMUM on one singular timeframe, across 4 different timeframes (20 total minimum) before I even propose a trading idea to my community.
♡
Disclaimer: Though I take banger trades, you MUST understand the following DISCLAIMER: I am NOT your financial advisor, a financial advisor, NOR do I give financial advice. If the market moves against you, you may sustain a total loss greater than the amount you deposited into your account. You are responsible for all the risks, financial resources, and trading system you utilize. You should not engage in trading unless you fully understand the nature of the transactions you are entering into and the extent of your exposure to loss. If you do not fully understand these risks you must seek independent advice from your financial advisor. This material is my market perspective and intended solely for educational & entertainment purposes.

NASDAQStill Holding this position, if we find support though ill consider closing. but anyways that was a good conspiracy trade

Target 150Following weekly chart
Clear cup & handle formation and RSI is supporting the short.
TP 150
SL 182
Please weekly close candle for stop.

Will history repeat itself? Interesting comparison from 08' & 22I was looking at the start of April 2008 through May 1st 2008, when I noticed similar price action from April 2022 through May 1st 2022.
On both charts, at the start of April to the 1st May the price fell an average of 16%. Since I know what happened in 2008, I used the fib retracement to see how much of retracement the NASDAQ would go and how long it would take. On the left chart, you'll see NDAQ retraced back to the .618 level on Wednesday, May 7th. then got rejected by the 200 day moving average. The following week the CPI report for April was released Wednesday, May 14th which caused a huge dump that lasted to the third week of May. That dump was a total of 19%. That is insane! So, I started to think maybe the same thing will happen this current May 2022. It is very possible that history will repeat itself. I decided to fib retracement April-May exactly how I retraced it in 2008. According to my calculation it should take 7 trading days in May 2022 to reach the .618 fib level. That is exactly where the 50 day moving average is at price $172. This is the same day the April 2022 CPI report will be released Wednesday, May 11th. If we retrace by then and then later the market dumps 19% like it did in May 2008. The dump will hit a current major support level at $140-145 zone! Well isn't that a coincidence? That price level $140-145 became the major support on Jan 2021. The same year that inflation started to take affect on our economy. Could it be possible that we crash this May as a symbol to end inflation?

Possible relief coming for stonks after fall from grace- 5d anomaly
- POTENTIAL HMA buy signal
- with the FOMC meeting later today and an expected 50bps rate hike, it is quite likely market has fully priced it in and we are looking at a sell the rumor buy the news type event
$NDAQ with a Bullish outlook following its earnings #Stocks The PEAD projected a Bullish outlook for $NDAQ after a Negative Under reaction following its earnings release placing the stock in drift D.


NASDAQ: H&S??The falling wedge concluded in mid-March brought prices to the highs of February, the most important highs of the year
now it seems to be confirming a inverted continuation head and shoulders

Long NASDAQPrice is rejected by weekly EMA(89) and in H4 price has broken up resistance and retrace to support. It's time to buy some Nasdaq

Nasdaq opening with huge 5% gapSell orders filled up the book order of nasdaq for now, let´s see what happens during the opening.
If we fill the gap before dumping more could be a good short opportunity, but I think that if things go sideways it won´t respect the gap at all.

Make what you will from itWith the global situation as of today, markets are shaky, investors are fearful, and many people are hoping to secure their gains from the past 2 years. Should there be a crash it'll be fast and swift. Be wary.

Nasdaq is definitely 💧 My full view and conclusion.. No confirmation and what so ever. Just looking for patterns that are continuing the 🐻 structure.
