Netflix. Time to Chill.Today, Netflix's (NFLX) price plunged below the Head & Shoulders neckline, with a pronounced downward move. This breach substantially elevates the likelihood of an extended bearish phase, potentially materializing as a significant sell-off leading into the forthcoming fall season.
Projections indicate a retracement towards the 0.5 Fib Extension level, where the price could test support at the mean price of $323.87. This mean price represents the average of the comprehensive bull run, which initiated from the May 2022 low of $162.73 and culminated at a peak of $485, the recent July 2023 top. However, the price could find support at the bottom parallel of the uptrend channel around $370 first before reaching the mean average price target.
Moreover, the recent FOMC minutes revealed the Fed's continued hawkish view on inflation and the possibility of further rate hikes.
We can also expect more fiscal tightening and an inflation resurgence to fuel the coming downtrends across most of the equities markets, especially big tech and crypto. This is particularly noteworthy as the economy could begin to contract due to overly tightened fiscal conditions, along with the looming threat of another Government shutdown in October. Additionally, credit usage, debt levels, and debt interest amounts are all increasing at a faster pace as we progress under these economic conditions.
NFLX trade ideas

No, i dont $NFLX and chill.while you worrying about getting her to chill, netflix have a nice short set up to give you money to take her out because she tired of netflix . IF we break 428 we should go back to demand at 415, nothing complicated and dont chase price if you not early. we dont rebound at demand then next target will be 397.

A Possible Head & Shoulders!A head and shoulders pattern is a technical analysis chart pattern that is formed by three peaks, with the middle peak being the highest. The two outer peaks are called the shoulders, and the middle peak is called the head. The pattern is considered to be a bearish reversal pattern, meaning that it signals a change from an uptrend to a downtrend.
The head and shoulders pattern is formed when buyers are initially successful in pushing the price of an asset higher, but their enthusiasm eventually wanes. The left shoulder is formed when buyers are unable to sustain the uptrend and the price falls back to a support level. The head forms when buyers attempt to push the price higher again, but they are only able to reach a slightly higher level than the left shoulder. The right shoulder forms when buyers once again fail to sustain the uptrend and the price falls back to the support level.
Once the price breaks below the neckline, which is the line connecting the lowest points of the two shoulders, it is considered a valid head and shoulders pattern. This signals that the uptrend is over and that a downtrend is likely to begin.
The head and shoulders pattern is considered to be one of the most reliable reversal patterns in technical analysis. However, it is important to remember that no pattern is perfect and there will always be exceptions. It is always a good idea to use other technical indicators and fundamental analysis to confirm the validity of a head and shoulders pattern before making a trading decision.
Here are some tips for trading the head and shoulders pattern:
Wait for the price to break below the neckline before entering a short position.
Set your stop loss order above the right shoulder.
Use a trailing stop loss to move your stop loss in as the price moves in your favor.

Netflix to breakdown?Netflix - 30d expiry - We look to Sell a break of 410.77 (stop at 430.77)
We are trading at overbought extremes.
485 has been pivotal.
Prices have reacted from 485.
Short term bias has turned negative.
Short term momentum is bearish. 411.50 has been pivotal.
A break of the recent low at 411.50 should result in a further move lower.
The bias is to break to the downside.
Our profit targets will be 360.77 and 350.77
Resistance: 430.00 / 445.00 / 455.00
Support: 411.50 / 390.00 / 370.00
Please be advised that the information presented on TradingView is provided to Vantage (‘Vantage Global Limited’, ‘we’) by a third-party provider (‘Everest Fortune Group’). Please be reminded that you are solely responsible for the trading decisions on your account. There is a very high degree of risk involved in trading. Any information and/or content is intended entirely for research, educational and informational purposes only and does not constitute investment or consultation advice or investment strategy. The information is not tailored to the investment needs of any specific person and therefore does not involve a consideration of any of the investment objectives, financial situation or needs of any viewer that may receive it. Kindly also note that past performance is not a reliable indicator of future results. Actual results may differ materially from those anticipated in forward-looking or past performance statements. We assume no liability as to the accuracy or completeness of any of the information and/or content provided herein and the Company cannot be held responsible for any omission, mistake nor for any loss or damage including without limitation to any loss of profit which may arise from reliance on any information supplied by Everest Fortune Group

Netflix has the most beautiful head and shoulders May be time to short $NFLX. I could see this heading to 351.

$NFLX - Potential head and shoulderNASDAQ:NFLX Netflix is looking like it is forming a head and shoulder pattern.
If it breaks below the $411 neckline, it could see a further breakdown that could see the price touch back the uptrend line that started since July 2022.
Here are the areas to watch for potential support and reversal:
- $411 (neckline)
- $387
- $368
- $354 (the worst case)
I will update the chart once I see a potential reversal.
Like and follow me for more charts.

Potential lower prices for netflixPrice action is strongly pointing to lower prices at this moment. A closure below 418-414 would be a strong confirmation for a short in my opinion. Nice head and shoulders and M pattern at the right shoulder.

NFLX head and shoulders daily?watching netflix over the last few weeks/months, seems to be making a clear head and shoulders move downward, and it would be enhanced by disney/hulu initiating the password sharing and limiting customers that were only paying for one or the other, the user pool was probably diluted from the password sharing as a majority of people dont want ads or pay extra premium....
just my thoughts, short term i am looking down but netflix is well established long term

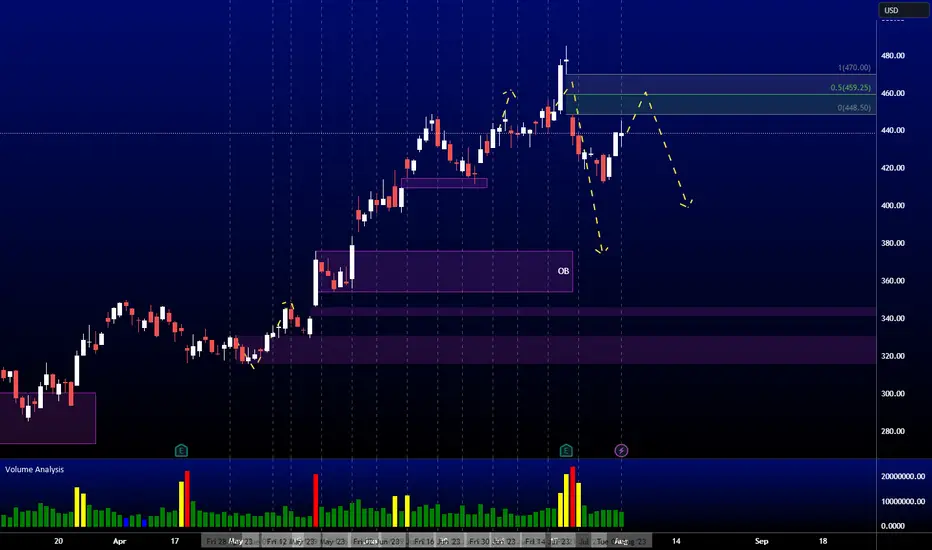
NFLX AnalysisPrice consolidated since my last analysis. No changes to my expectations, I'm still expecting price to continue higher to fill the fair value gap at 459.25.

Netflix Ventures into Video Game Streaming: A Game-Changer in th
Introduction:
We are calling all savvy traders! Brace yourselves for a groundbreaking announcement that has the potential to reshape the entertainment industry as we know it. Netflix, the streaming giant that has revolutionized the way we consume movies and TV shows, is now stepping into the realm of video game streaming. This exciting move will diversify Netflix's offerings and open up a world of opportunities for the company and its loyal subscribers.
The Game-Changing Leap:
Netflix's decision to enter the video game streaming market signifies a strategic shift that promises to captivate gamers and entertainment enthusiasts. With a vast user base of over 200 million subscribers worldwide, the platform's foray into gaming is poised to disrupt the industry and create a new era of immersive entertainment experiences.
Why This Matters:
By expanding its services to include video game streaming, Netflix is tapping into a multi-billion-dollar market, further solidifying its dominant force in the entertainment industry. This move diversifies their revenue streams and enhances their competitive edge, enticing new subscribers and keeping existing ones engaged for extended periods.
The Netflix Advantage:
What sets Netflix apart from traditional gaming platforms is its ability to leverage its vast content library and recommendation algorithms to curate personalized gaming experiences. Imagine a world where Netflix recommends movies and TV shows and suggests video games tailored to your preferences. This integration of gaming into their existing ecosystem creates a seamless and immersive user experience, making Netflix an all-in-one entertainment hub.
The Call-to-Action:
As traders, it's crucial to recognize the immense potential that Netflix's entry into video game streaming brings. This exciting move will drive the company's growth and create new investment opportunities. By diversifying its offerings, Netflix is positioning itself for long-term success and continued innovation.
So, don't miss out on this game-changing opportunity! Keep a close eye on Netflix's journey into video game streaming and consider adding it to your investment portfolio. Stay informed, analyze the market trends, and seize the potential rewards that lie ahead as Netflix continues to redefine the boundaries of entertainment.
Conclusion:
Netflix's decision to venture into video game streaming is a bold and exciting move that has the potential to revolutionize the entertainment landscape. By diversifying their offerings, the streaming giant is primed to captivate a broader audience, enhance user engagement, and create new avenues for growth. As traders, it's essential to recognize the significance of this move and stay ahead of the curve. So, gear up for a thrilling ride as Netflix transforms the way we play and stream, and seize the opportunity to long Netflix as they embark on this exhilarating journey into the world of video game streaming.

NFLX HEAD & SHOULDERSA clear pattern of HEAD & SHOULDRS PATTERN .
From here we can expect it to get down below the EMA 50 and find some support at 411 ,
we could expect a small pullback above the 411 then break the support and go below the 411.
Always remember that stocks follow SPY direction and movement. you can see more info on SPY movement on my profile here.

#NFLX#NFLX
- according to technical analysis, NFLX collapse is very likely
- I would see it at around 385

Bearish IdeaThe entire market is looking bearish, at least for the time being, but the reason I chose NFLX is because not only did it lose the Daily 50 SMA, but also because of the massive Head & Shoulders pattern that has been forming since June, with support at the neckline around 412'ish to 415'ish.
If it breaks below the neckline, lookout below. It would be looking extremely Bearish with support at the Daily 100, 150, 200 moving averages as well as the trendline.
Warning: This is strictly an idea which don't always play out and in no way is financial advice. It is merely an opinion.
Happy Trading!

NFLX just pulling back to support.Wait for NDX correction finishWait for NDX pull back finish; price far from 21 & 50 MA in weekly. $380 around is good price. $410 is daily support. Have to see the price action. Pull back, correction going on. Daily chart doesn't look that good.
Weekly looks very good.

NFLX head and shouldersVery clear head and shoulders pattern on $NFLX. Looks like it will go to the bottom of the channel testing as low as the 200dma and previous break out.

Netflix inc NASDAQ BEARISH trendNetflix ind NASDAQ make head and shoulder pattern ane it seems to move down because it break the neckline also

Potential head & shouldersMy short zone just to add to my short just did not work out. No guarantees here, but shell we see if this head & shoulders works out ;-) I am looking for a 10% TP.

NFLXPrice consolidated since my last analysis. No changes to my original expectations, I'm expecting price to fill the fair value gap at 459.25 next before going lower.

NFLX-In Bearish Trend NFLX is making Head and Shoulder pattern,It indicates that market is in Bullish Trend.You can open your trade on your own TA and risk management.

Good pull back to $365 | Long BiasDaily Chart
Netflix NASDAQ:NFLX has downed from $485 to $431.6 now
Netflix has the support zone around $365 that is good level to buy for next bull run
Wait for next move

SHORTTargeting the first minor support at 385 price level
Stop should be tightly set around marked level with managed risk
Trade safe, good luck

NFLX AnalysisPrice consolidated since my last analysis. Price is currently on a bullish retracement to fill the fair value gap at 459.25. From there, we should see price continue lower following the bearish order flow.
$NFLX Pullback & Breakout?NASDAQ:NFLX looks to be breaking out after a short consolidation period. This pullback, even though it had big initial volume, has been orderly and shallow. I went long ½ size position on Friday July 28 on the gap up open and made it a full-sized position today. See notes on chart for my thinking.
Ideas, not investing / trading advice. Constructive comments always welcome. Thanks for looking. Hope this helps.
