Nio Formed Double bottomNio Formed double bottom at 7.54 after long consolidation hoping to move up from here expecting to reach around 22
NIO/N trade ideas

More downside for Nio [KalaGhazii]Nio (NIO) led Chinese EV stocks lower in the wake of poor Tesla (TSLA) earnings.
For its part, Nio expects to report a loss for the quarter on Nov. 9.
The EV maker is also looking to sell branded chips and smartphones.

Nio upwardsNio finished the retreat of Wave2 at $7.93.
I expect Wave3 between $26.18 - $32.36. As the daily traded value remains low Wave3 can end in 2024.

NIO BULLISH LONG TERMBased on deep analysis NIO’s future price forecast is bullish. There are multiple indications towards oversold, buyers moving in, and plenty of consolidation with repetitive movements between price levels 8.50$-9$. Will update if any new data changes my forecast outlook.

$NIO - $4.60 Price Target intact with 2nd Bear FlagI called the previous bear flag which did eventually completed the bear flag and continued to leg down. A 2nd bear flag has now formed. Imminent further breakdown. If the initial bear flag plays, out, price target should hit around $4.60 (length of pole of flag = measured downside).

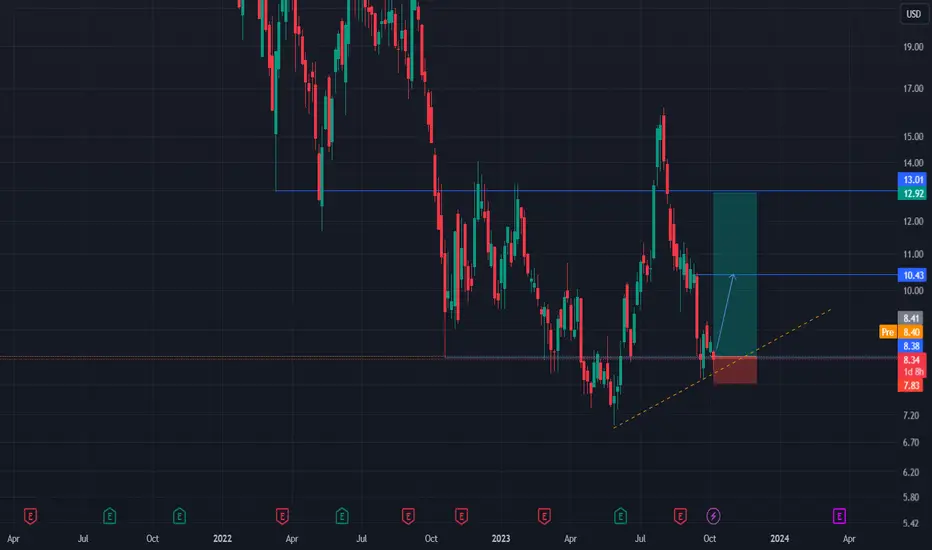
NIO range high retestHello, NIO price is potentially making a higher low on 3D chart. We expect a continuation higher, if the price stays above trend line. First take profit is 10.43 $ and main target 13 $. Good luck.
NIO is looking for a 100% retracement into $16 areaWe are looking at NIO right now.
We have a valid break of structure on the weekly timeframe. Price has retraced back into the demand zone just below the low made after the Change of Character. We are seeing a reaction from the GAP right below the CHoCH low.
We have zoomed into the 1hr timeframe, and seeing a bullish structural setup being created. We are waiting for the BOS (Break of Structure to happen, to confirm bullish sentiment. Followed by a retracement back into the low of the CHoCH and reaction to the order block below it.
If these structural elements are confirmed, there is a solid chance that NIO is looking for a push to the upside at $16.
I would definitely keep an eye out for NIO maybe a 2-3 month expiration call option play with a strike around $15 to give you that ITM premium once price pushes above it.
Keep your eyes on NIO in the short term.

$NIO broadening formationNot Financial advice!
NYSE:NIO since the beginning of the year working on this broadening formation, currently almost at the lower part of it. as long as the yellow line is not broken then we can see some upside otherwise we will revisit the lower part of the formation! Be cautious!
Thank you! #share and #subscribe

NIO CHANGED MY LIFE EV is the future and im going all in on the future always that said yay for Chinese Tesla
my strategy is always root for the underdog
Technical Analysis
I am expecting price to react to my supply zone driving itself lower from there to either one of my resistances where I will seek out increasing bullish momentum among the candle sticks to indicate price going higher and from there im expecting sweet stonks stonks stonks as price breaks my supply zone
Fundamental
Despite the transitory slowdown, NIO remains a solid growth company with significant expansion potential and substantial EPS growth prospects, As NIO's revenues continue expanding, its profitability should improve, leading to multiple expansions and a much higher stock price in future years. Source: Seekingalpha
NYSE:NIO is a sleeping giant and im rooting for her 100%

Not liking thisIf it gives 3 up and 5 more down, i would long this one.
if not, this whole structure from the bottom of june can be counted as a 3 wave move up.
Stop loss is the king

I'm hoping for $10 end of the month NIONIO delivered 15,461 units in September, up about 44% from the same time last year. For the third quarter, NIO delivered 55,432 units, up about 75%

NIO AnalysisPrice played out nicely as my last analysis, giving us a -23.23% move to the downside. However, price failed to mitigate the bullish OB at 7.92. Right now, I'm expecting price to fill the FVG at 10.22 before continuing lower.

Bullish Alert : NIOAfter a drop of 45%, EMAs are testing each other again for the third time.
The previous 2 failed.
Possible reversal here after the bottom at $8.4

💰5 Reasons To Use The ''Rocket Booster'' Strategy📈💹Why you should only buy below $10 stocks
---
#1 - These stocks are more volatile
#2 - You will gain at least 2% profit or loss
#3 - This is a better risk management
#4 - And you won't get to use margin
#5 - This reduces your risk levels
---
Disclaimer:
--
This is not financial advise
do not buy or sell any stock
or anything i recommend to you
--
Do your own research before you
trade
--
Show me some support for giving you
this FREE Knowledge and
rocket boost this content

NIO BIG MOVE SOON!Shares of Nio (NIO -2.11%) slumped this week and were trading 17% lower through 11 a.m. ET Friday, according to data provided by S&P Global Market Intelligence. Despite a positive opening on the last trading day of the week, Nio stock has now lost more than 40% value since Aug. 1, thanks to this week's extended weakness.

$NIO - $4.60 Price Target with cracked flag, WEEKLY Death Cross I have been posting ever since the weekly flag has been setting up, the stock has finally cracked below the flag. If you have shorted on the crack, kudos to you. Potential downside is to $4.60. Remember the length of the flag pole equals to the potential measured downside which normally equates to about same length of the original bearish flag pole. We also see a bearish death cross on the weekly MACD and the squeeze mod is also curling over in a bearish downturn.

Nio _ Bullist TradeBased on my analysis, it appears that a bullish trend may be on the horizon for this particular asset. If you find the opportunity to monitor its performance, it could be advisable to consider making a purchase when the Relative Strength Index (RSI) value reaches or approaches the 50 level. This strategic approach could potentially align with a favorable market entry point.

Nio to $20And then onwards and upwards.
** Investment opportunity **
On the above 12 day chart price action has corrected since a sell signal printed at $57 back in January 2021. A number of reasons now exist to be long. They include:
1) Price action and RSI resistance breakouts.
2) Price action confirms support on past resistance. Look left.
3) Price action is on the Golden Ratio.
4) No stock splits.
Is it possible price action corrects further? Sure.
Is it probable? No.
Ww
Type: Investment
Risk: 6-10%
Timeframe: A long position between now and end of October 2023.
Return: 1st target $20. 2nd target, will say elsewhere.

NIO's $7.53 price target after $1 billion debt leads to 17% dropNEWS:
New Debt, New Woes: Nio Raises $1 Billion, Shares Tumble by 17% Amid Financial Struggles
Nio announces plans to raise $1 billion in new debt through the issuance of convertible senior notes, leading to a 17% drop in its share price.
The new debt will consist of $500 million worth of convertible senior notes due in 2029 and another $500 million due in 2030. An overallotment option could increase total new debt to $1.15 billion.
The move comes after Nio reported financial losses of $2.1 billion and a negative free cash flow of $1.6 billion in the previous year.
S&P Global Market Intelligence predicts Nio will not achieve profitability until 2027.
Funds from the new debt issuance will partially be used to pay off existing debt and to strengthen the balance sheet.
The company's strategy doesn't address the core issue of profitability, leading to concerns about future debt offerings and market sell-offs.
CHART ANALYSIS:
NIO's $10.18 support level has held as strong support since August 25, but the recent bearish news has broke this support level.
I have my eyes on $7.53 as a key price level that aligns with the green trend line and lower end of my buy zone. The lower end of the Bollinger Band is currently sitting near this price level as well.
I think there could be a dip or wicks below the green support level for the best buying opportunity there.

$NIO - $4.60 price target on Weekly Bear FLAGI posted on last two charts saying that there looks to be a bear flag setting up. The flag is now setting up nicely on the Weekly Chart and is rock solid intact. The longer it solidifies the flag, the more likely it plays out. Watch for a imminent break, if cracked flag, measured move to the downside is around $4.60 which is also around a past support area.

Nio Weekly Wave countAppears to be a wave 4 out of 5 as per weekly time frame chart, very clear wave count down from Nio's peak. 3 subdivided very cleanly thus we should be looking at a wave 4 up.

ABC/DThis stock is Not to long entry level.
EL needs to be met with a trend in that direction.
Possible stop below C.
Target is D.
Short interest is around 7%.
No recommendation.

NIO AnalysisPrice consolidated since my last analysis. No changes to my expectations, I'm expecting price to take out the buy-side liquidity at 12.41 next before heading lower.
