NUS Pullback Breakout – Next Stop: $10.50?!""
📊 Trade Setup Summary:
Ticker: NUS (NYSE)
Pattern: Pullback breakout after bull flag / wedge
Entry: $8.63 (break above yellow line)
Stop Loss: $8.05 (white support zone)
Target Zones:
TP1: $9.35 (red resistance)
TP2: $10.50 (green target)
Risk/Reward: Roughly 1:2+
Volume: Increasing near breakout — positive sign
NUS trade ideas

Incoming 200% gain for Nu Skin Enterprises ??On the above 6 day chart price action has corrected 80% since January 2021. A number of reasons now exist for a long position.
1) Price action and RSI resistance breakouts.
2) Regular bullish divergence.
3) Support and resistance. Look left. Price action is on legacy support. See monthly chart below.
4) No share splits.
5) Market structure broke around 30 and has never been tested. That is a 200% rally until resistance.
Is it possible price action continues to correct? Sure
Is it probable? No
Ww
Type: trade
Risk: 2-3%
Timeframe for long: weeks
Return: 200%
Monthly chart

NU SKIN Stock Chart Fibonacci Analysis 012324Trading Idea
1) Find a FIBO slingshot
2) Check FIBO 61.80% level
3) Entry Point > 18/61.80%
Chart time frame : B
A) 15 min(1W-3M)
B) 1 hr(3M-6M)
C) 4 hr(6M-1year)
D) 1 day(1-3years)
Stock progress : A
A) Keep rising over 61.80% resistance
B) 61.80% resistance
C) Hit the bottom
D) Hit the top
Stocks rise as they rise from support and fall from resistance. Our goal is to find a low support point and enter. It can be referred to as buying at the pullback point. The pullback point can be found with a Fibonacci extension of 61.80%. This is a step to find entry level. 1) Find a triangle (Fibonacci Speed Fan Line) that connects the high (resistance) and low (support) points of the stock in progress, where it is continuously expressed as a Slingshot, 2) and create a Fibonacci extension level for the first rising wave from the start point of slingshot pattern.
When the current price goes over 61.80% level , that can be a good entry point, especially if the SMA 100 and 200 curves are gathered together at 61.80%, it is a very good entry point.
As a great help, tradingview provide these Fibonacci speed fan lines and extension levels with ease. So if you use the Fibonacci fan line, the extension level, and the SMA 100/200 curve well, you can find an entry point for the stock market. At least you have to enter at this low point to avoid trading failure, and if you are skilled at entering this low point, with fibonacci6180 technique, your reading skill to chart will be greatly improved.
If you want to do day trading, please set the time frame to 5 minutes or 15 minutes, and you will see many of the low point of rising stocks.
If want to prefer long term range trading, you can set the time frame to 1 hr or 1 day.

Trading Idea - #NuSkinMy trading idea for - Nu Skin - BUY based on strong seasonality!
Entry: 40.00 USD
Target: 44.00 USD (+10% profit)
Nu Skin Enterprises is a direct sales company for health and beauty products.
I am buying a position in Nu Skin because of its strong seasonality.
In the period May to early August, the stock has outperformed its index (SP500) by at least 4% each year (for the last 20 years).

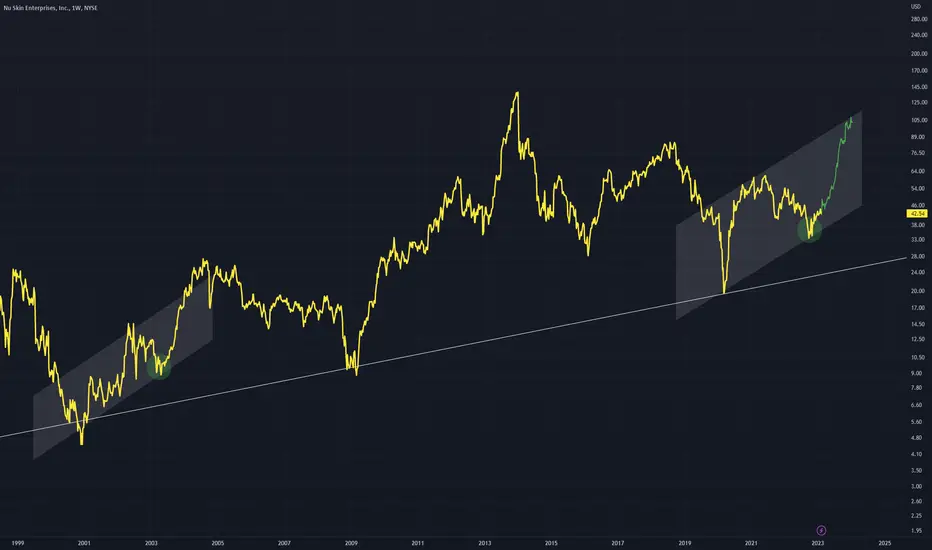
NUS - Comparing Two Channels Similar channels can be seen on chart
Similar points also can be seen in green circles
Using this comparison we can expect a rise coming on the latest channel.
Bullish above the dominant trend line in white.
NUS could be bearish and fast if break downTHE CONSISTENT TRADES analyze EL as a bearish /weak fundamental stock and therefore would be traded only in a short position.
NUS is in a triangle and is close to all major MA which could be an indication of a strong move soon. A breakdown below the red dotted line would be triggered for a short position.
Volume is for now neutral.
Price is above all major MA which is actually bullish.
RSI has bearish negative divergences which indicate stock could drop soon.
MACD also has bearish divergences.
Overall: NUS is close to the end of the triangle, no more space. If it breaks down below the red dotted line it could be a very strong and powerful drop because at the same time would drop below BigRed and also below 50 days MA

NUS daily - inside in big rising wedge - bearishNUS daily - even though NUS is above BigRed (200 days MA) is close to a breakout of a big rising wenge which is a very bearish pattern.
Volume is neutral to bearish because this whole leg up is on volume below 20 days average volume.
At the moment NUS is above all major MA (8, 20, 50, and 200) which is bullish.
RSI is in the mid to oversold area which could indicate a possible drop in the near future also it has strong negative divergences meaning the price is moving up strong while relative strength is not, which is very bearish.
MACD histogram starts to tick down which is more bearish than bullish. MACD also has strong bearish divergences which are very bearish.
Overall: MUS is at the moment in the most bearish pattern - rising wenge. Breaking below the blue dotted line would open the possibility for a short position with a stop loss above the recent high. As MUS is bearish fundamental stock at the moment, I would trade it only to the downside.

NU skin enterprises nasdaq long position bullish indication
higher high higher low
green candles
crossed resistance level
head and shoulder chart pattern
plan
buy 49.46
stoploss 46.58
tp1 52.01
tp2 54.12

Head and Shoulders pattern on NUSSo far I see a decent H&S Pattern on Symbol NUS so it could be a great opportunity for a trend reversal. Not Financial advise just my opinion Trade at your own risk. I will update this as it develops and hopefully continues in bullish pattern. Please feel free to comment and share Ideas.

NUS LONG USING PVSRA - ANALYSIS BOTH D AND W CHARTSI used PVSRA to spot the accumulation (see the colored candles) with notable volume that you can see at the volume bar.
I see a great chance for this stock to go up until the next earnings announcement.
It is going long the trend line very well on the weekly chart too.
NUS (weekly)
EP = 48.84
ATR = 4.66
1.5ATR = 6.99
SL = 41.85
TP1 = 53.5
TP2 = 58.16

$NUS - Oversold on Daily- Adding to watchlist for Tuesday morning.
- Just past earnings, which seemed good, but investors reacted to a change coming to CEO.
- Seems like it wants to test that volume shelf on the Daily as well.
- Oversold on RSI.
I red opening down to the volume shelf on Tuesday, and then a bounce to green would be a nice entry. Bet it recovers that large red candle if it does that.

NUS, Triangle Ascending (bullish)I found this pattern at tickeron website with the following data:
STATUS = Confirmed
CURRENT CONFIDENCE = 70%
TARGET (EXIT) PRICE = 52.67 USD
BREAKOUT (ENTRY) PRICE = 52.10 USD
DISTANCE TO TARGET PRICE = 0.65%
EMERGED ON = Nov 17, 10:00 AM (EST)
CONFIRMED ON = Nov 17, 11:02 AM (EST)
WITH CONFIDENCE LEVEL = 74%
The Ascending Triangle pattern forms when the price of a security tests a resistance level and creates a horizontal top line (1, 3, 5), with an upward-sloping bottom line (2, 4) formed by a rising support level. The breakout can either be up or down, and it will determine whether the target price is higher or lower.
This pattern is commonly associated with directionless markets, since the contraction (narrowing) of the market range signals that neither bulls nor bears are in control. When the price of a security consolidates around a certain level, it may indicate growing investor confidence for a significant uptrend.
Trade idea
Once price breaks outside of the triangle, day traders and swing traders should trade with an UP trend. Consider buying a security at the upward breakout level. To identify an exit, compute the target price by adding the pattern height to the breakout point. For upward breakouts, the level is the top horizontal line (1, 3, 5). The pattern height can be calculated by taking the difference between the resistance level set by the horizontal line, and the lowest low.
To limit potential loss when price suddenly goes in the wrong direction, consider placing a stop order to sell at or below the breakout price.

NUS ready for liftoff?NUS went from $27.46 to $31.26 in one trading day that was the first of two great days. On the last trading day it passed it's 200 day moving average which was $35.55. It was a big accomplishment but now we have to wait till the next trading for it to hold above $35.55 to confirm it's bullish run.


NUSNotes on chart for starter postion. The Red line is wide stop, so would either wait or play small to allow to double down if it is retested. Just my personal thoughts.

NUS Uptrend supportNUS has made a bearish move recently, with the formation of a possible descending scallop (looks a bit off) and support on the uptrend, price looks ready to move up. Included Fibonacci retracement levels. Weekly chart.

$NUS Short Idea after USNA reports terrible growth in China$NUS short idea after similar company $USNA reported earnings last week and gapped down 20%. USNA reported a slowdown in growth in China due to Chinese distaste for Multi-Level-Marketing. NUS will have the same problems when it reports, as it has promised growth in China

NUS pullback to multi support levelsNUS
Gaped up on earnings not to long ago and is now softly finding support on the the daily MA's and Fib's.
NUS
Horizontal S&R: no, but is w/in fib replacements and $80 level
Channel S&R: yes, rising up trend.
MA S&R: above both 20 and 50
>200ma: yes
Volume confirmation: no, just a slow drift down.
Candle Confirmation: yes, morning star at bottom of break from reg trendline
Stoch Divergence: no, but stoch back down to oversold
Reg Trendline >85: yes , 91
Short Float: yes 54
Risk / Reward: stop 78, price target 88, entry 81~
Zacks score:
Rank: 2-Buy
Style Scores: B Value | B Growth | B Momentum | Industry Rank: Top 46%(118 out of 255) Industry: Cosmetics

NUS Detected possible increase in guidance!!!NUS: nu skin enterprises
2018-08-02 16:17:41
Detected possible increase in guidance

Consumer Goods or Health CareSome specialized Websites have this company categorized in different industries and sectors, because is a consumer good but at the same time is in the health care industry
in the official NASDAQ web is a Health Care Company
in the YAHOO_Web is a Consumer Goods Company
in the MORNING STAR web is a Household & Personal Products
If a reader look several of my past post can appreciate that I write about the number of companies listed in NYSE and NASDAQ
and there are around 6390 Listed companies distributed in 10 Industries, the reader can look that I constantly write about
how I pick stocks and that I not publish a stock symbol twice or I not publish the same idea twice
That I do no use a stock screener for pick stocks I watch stocks one by one and I have my personal list that I follow,
NEVER I LOOK FOR IDEAS ON SOCIAL NETWORKS because “you only learn by making mistakes”
I follow 1300 companies approximately and constantly look one by one
And that takes a lot of time compared to the use of a stock screener
The affair is that the stock market is too Big and is divided in Industries and sectors and companies are categorized according to your size
look at this for you to make an idea
en.wikipedia.org
then go to the official NASDAQ web and look all the Industries
www.nasdaq.com
And apart from those 6390 listed companies
there are more companies called Unlisted Securities
www.investopedia.com
plus others called penny stocks
en.wikipedia.org
There are thousands of thousands of companies (stocks)
I follow 1300 companies approximately divided in 10 Industries
that does not mean that today I has reviewed 1300 companies, because I have my order
but for post this idea, today Sunday 03/18/2018 I spend hours searching
This is not about Technical Analysis and Indicators
This is about the time, plus a trained eye

NUS: Ever Used Nuskin Product? Product Or Stock, Which Do U LikeNUS underwent a brutal selloff from its 2014 high of $140+ all the way down to $23+ which bottom in 2016.
Prices have since recovered to about half of its all time high.
From a technical perspective, this recovery does not appear to be complete.
A price target between $80-90 appears to reasonable at this point in time.
Once Minor Wave C is completed, I am expecting Nuskin to plunge to all time lows.
A break of $46.35 from current price could imply the following:
(1) A more complex correction Wave B is forming before Minor Wave C starts (preferred alternate count)
(2) Minor Wave C is completed and prices are expected to plunge to all time lows

Nu Skin entering bullish accelerationAfter having drawn a very pure inverted head and shoulders over 1000 days, Nu Skin has broken its neck line and is now entering a bullish acceleration phase. It is really the good time to buy this stock. Potential return is between 50 and 100%

