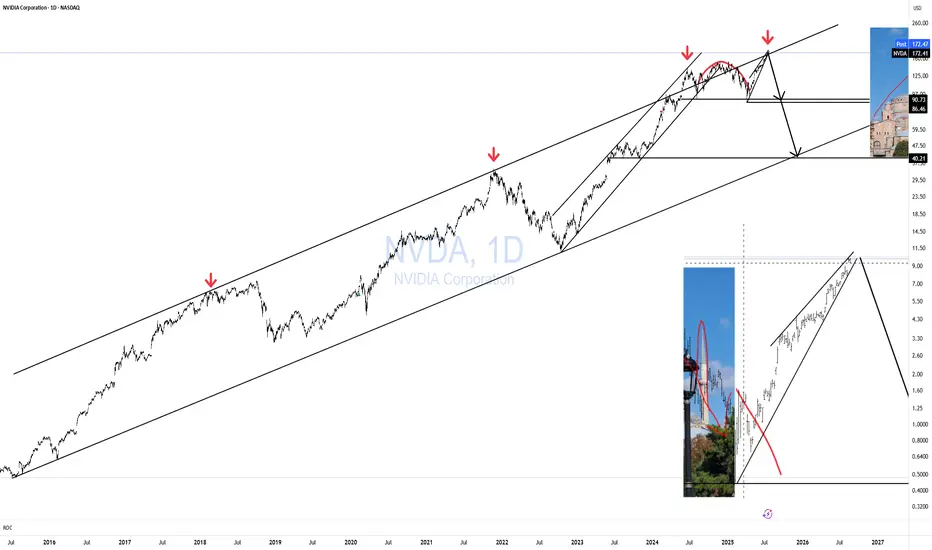
NVDA HAGIA SOPHIA!The Hagia Sophia pattern has now fully formed; it just needs the crack! and the Hook!
No matter what your vague hunches and feelings are about AI, the charts will always win.
You can't "buy the dip" unless you know when to "Sell the Rip"!
If you can't see this resistance area, I don't know what to tell you.
Everyone is bullish at the top of a bubbliotious market without exception!
Click boost, Like, Subscribe! Let's get to 5,000 followers. ))
NVDA trade ideas
Nvidia - This is clearly not the end!📐Nvidia ( NASDAQ:NVDA ) will confirm the breakout:
🔎Analysis summary:
Over the past couple of months, Nvidia managed to rally about +100%, reaching top 1 of total market cap. Most of the time such bullish momentum just continues and new all time highs will follow. But in order for that to happen, Nvidia has to confirm the all time high breakout now.
📝Levels to watch:
$150
🙏🏻#LONGTERMVISION
SwingTraderPhil

NVDA stocks Buy Trade with Take Profit - Stocks SPOT ACCOUNTStocks SPOT ACCOUNT:
NASDAQ:NVDA stocks my buy trade with take profit.
This is my SPOT Accounts for Stocks Portfolio.
Trade shows my Buying and Take Profit Level.
Spot account doesn't need SL because its stocks buying account.

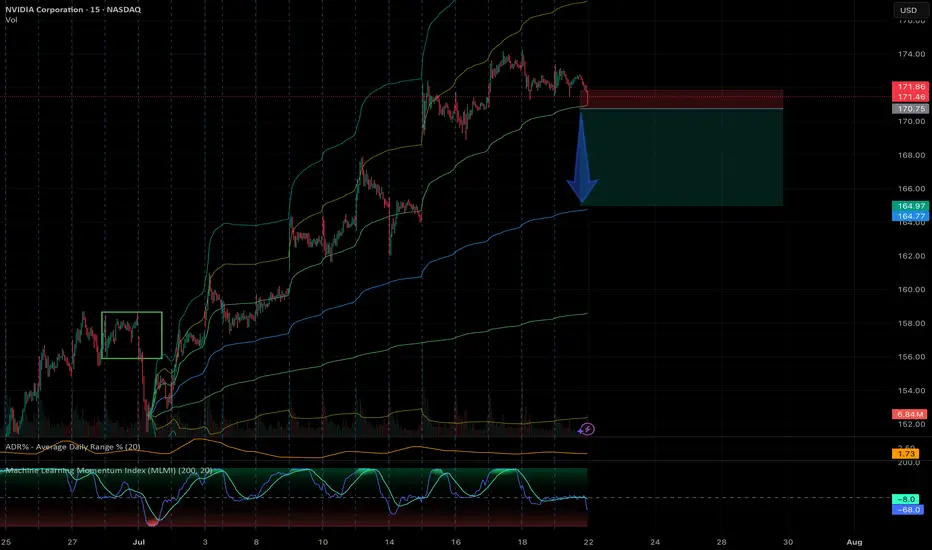
NVDA - AVWAP Breakdown15 Min MLMI appears to be breaking down, meaning that it will continue to fall further.
Stock likely to pull back to the monthly AVWAP level around $165.
Rare Buying OpportunityBig players are quietly accumulating NASDAQ:NVDA — time to join in.
NASDAQ:NVDA isn’t just a stock — it’s the future of AI.
This pullback? A gift in disguise. #BuyTheDip
Expect to take profits very soon.

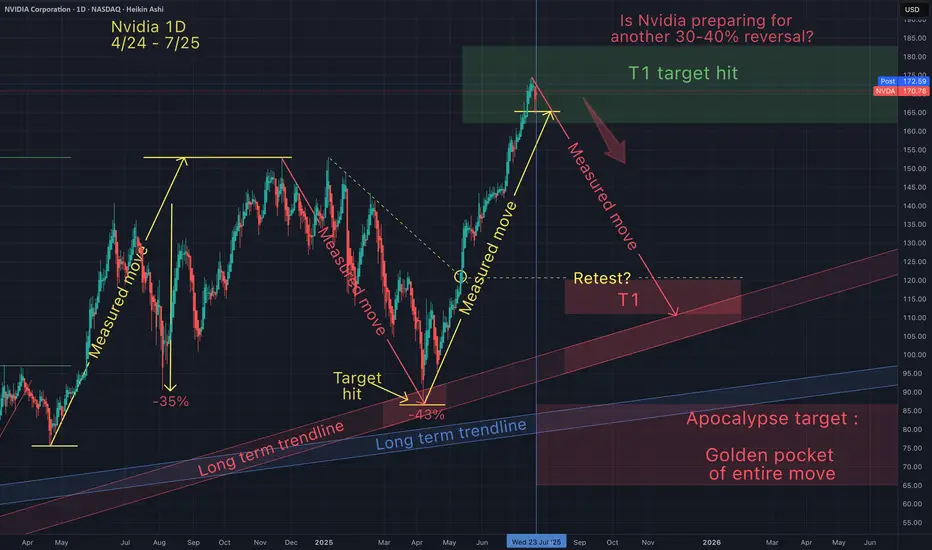
NvidiaIs Nvidia preparing for another 30-40% reversal. I hope not!
But I do want to be prepared in case we do get another dip buying opportunity.
99% of people buying $NVDA don't understand this:🚨99% of people buying NASDAQ:NVDA don't understand this:
NASDAQ:GOOGL : “We’re boosting AI capex by $10B.”
Wall Street: “Cool, that’s like $1B or 0.06 per share for $NVDA.”
So from $170.50 at the time of news to $170.56 right?
No.
NASDAQ:NVDA trades at 98× earnings. So that $0.06? Turns into $6.00
Why?
Because people are expecting that to be happening every single year for 98 years and they're paying All of it Today in Full amount.
So NASDAQ:NVDA will get $1B more per year. But NASDAQ:NVDA price per share already increased by $100B in past 2 days 😂
Then it crashes 40% and everyone is wondering why.

Elliott Waves indicate a possible correction.We may be at a peak, and a correction within the second wave could be approaching. This is suggested by Elliott Wave theory, as well as divergence on indicators and technical analysis patterns.

$NVDA Tradespoon – Long Entry $172.41Tradespoon model generated long signal for NASDAQ:NVDA . Predicted range: $172.41–$175.21. Trend: +0.65%. NASDAQ:NVDA

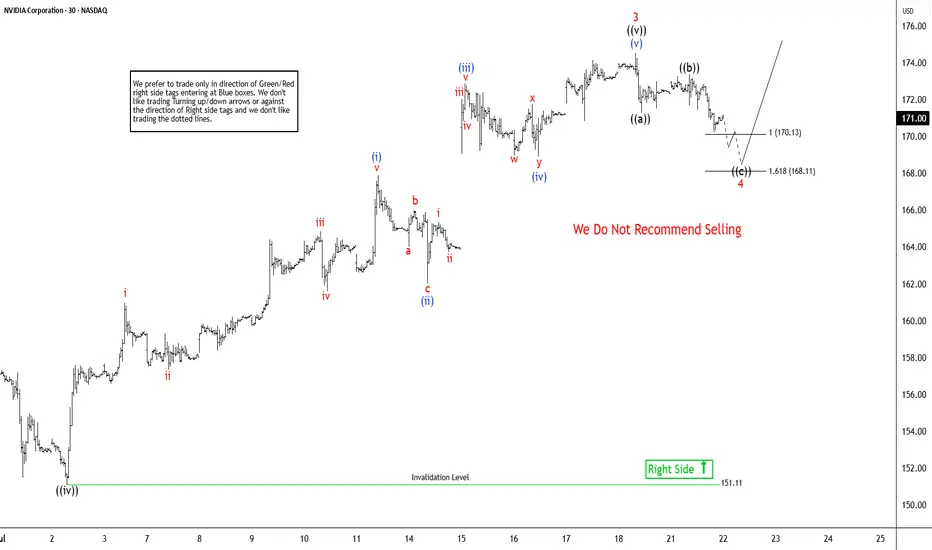
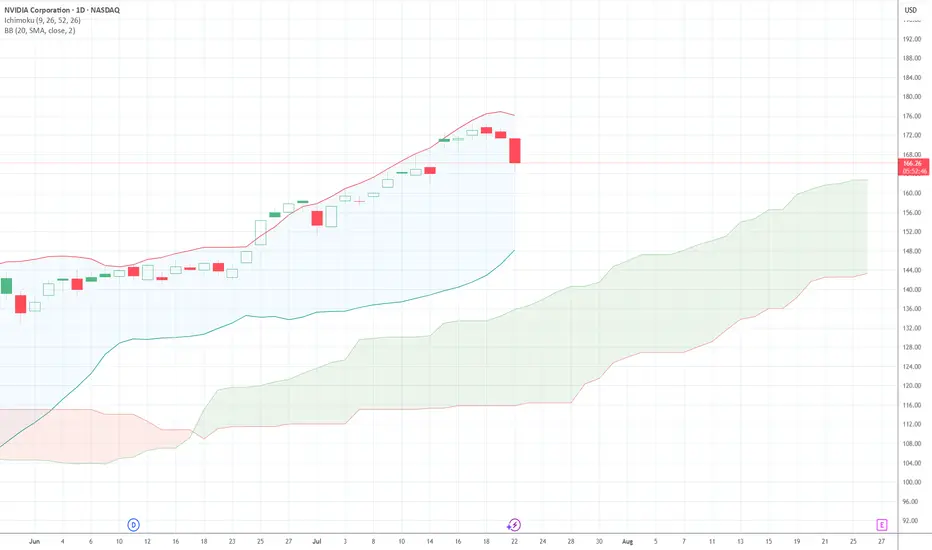
Elliott Wave Sequence In NVDA Suggests Rally From SupportNvidia (NVDA) continues rally to new all-time highs from April-2025 low and reinforcing a robust bullish outlook. In daily, it ended 7 swings pullback at 86.62 low in 4.07.2025 low started from 1.07.2025 high. Above April-2025 low, it confirmed higher high bullish sequence & pullback in 3, 7 or 11 swings should remain supported. Since April-2025 low, it favors rally in (3) of ((1)), while placed (1) at 115.44 high & (2) at 95.04 low in 4.21.2025. Above there, it placed 1 of (3) at 143.84 high, 2 as shallow connector at 132.93 low & 3 at 174.53 high. Wave (3) already extend beyond 2.0 Fibonacci extension of (1) & yet can see more upside. Within 1 of (3), it ended at ((i)) at 111.92 high, ((ii)) at 104.08 low, ((iii)) at 137.40 high, ((iv)) at 127.80 low & ((v)) at 143.84 high. Above 2 low, it placed ((i)) of 3 at 144 high, ((ii)) at 137.88 low, ((iii)) at 159.42 high, ((iv)) at 151.10 low & ((v)) at 174.53 high as 3 of (3).
It already reached the minimum area of 170.04 as inverse extension of connector. But it can see more upside as daily move showing highest momentum from April-2025 low. In 1-hour, above ((iv)) low, it placed (i) of ((v)) at 167.89 high in 5 swings, (ii) at 162.02 low, (iii) at 172.87 high, (iv) at 168.90 low & (v) of ((v)) at 174.53 high ended as 3. Currently, it favors pullback in 4 targeting into 170.13 - 168.11 area before rally in 5 or at least 3 swing bounce. Within 4, it ended ((a)) at 171.26 low, ((b)) at 173.38 high & favors lower in ((c)) of 4. It should find support in extreme area soon to turn higher for two more highs to finish ((1)). The next move in 5 of (3) can extend towards 175.9 or higher, while pullback stays above 168.11 low. The next two highs expect to come with momentum divergence to finish cycle from April-2025 low. Later it should see bigger pullback against April-2025 low in 3, 7 or 11 swings. But if it extends higher & erase momentum divergence, then it can see more upside.
Is it finally time for a rally?Looking at NVIDIA (NVDA) on the weekly chart over the past two years, a significant gap up becomes apparent around April, which persisted for much of the year. Considering the recent news and the stock's pullbacks lately, this may be the moment for NVDA to resume its upward grind. The coming weeks will reveal its direction.
Additionally, it's worth noting the formation of a massive bull pennant on the weekly chart. If history repeats itself and this pattern holds, the next 2 to 6 weeks could prove to be a thrilling period for NVDA.

Catch the bounce on NVDAHi, I'm The Cafe Trader.
We’re taking a deeper dive into NVIDIA (NVDA) — one of the leaders in the MAG 7 — with a short-term trade setup you can apply to both shares and options.
Setup Context:
NVDA is pushing into all-time highs, and we’re now approaching the average analyst price target (around $180). While we don’t know how price will react at this level, traders should be watching for pullbacks and trend continuations — prime zones for entry.
If we get a strong move down, I see $153 as a high-probability bounce area — where buyers are likely to step in aggressively.
Price Target Outlook:
The final price target will depend on how price moves into this zone:
- If NVDA runs to $200 before pulling back, targets shift higher.
- If it tops out around $180, we adjust accordingly.
That said, an initial bounce toward $169–$170 looks reasonable.
Options Note:
If NVDA sells off hard and fast, implied volatility (IV) will spike, making options expensive and reducing your edge. This is a setup that could play out over 2–3 weeks, but the first bounce could be quick — so timing matters.
Strategy: Staggered Entry Using Two Contracts
Use two contracts — one short-term, one mid-term — to maximize reward while managing time decay.
Contract 1: Short-Term (3–5 Days to Expiry)
Trigger Entry: As soon as price taps the demand zone (~$153)
Strike Entry Price ^^Target Price
155 $2.00 ^^ $6.00
157.5 $1.50 ^^ $4.50
160 $0.75 ^^ $2.50
You’re looking for a quick reaction: get in, take profit, and step aside while the market finds new balance.
Contract 2: Medium-Term (7–10 Days to Expiry)
Timing Tip: Wait for NVDA to stall or consolidate after the initial bounce — this is when IV comes down and contracts get cheaper.
Strike Entry Price ^^Target Price
155 $3.00 ^^ $15.00
157.5 $2.50 ^^ $12.50
160 $1.80 ^^$9.00
Important: Be careful trading too close to earnings. Contracts tend to get overpriced right before and after earnings drops.
That wraps up the short-term NVDA view.
Stay tuned for more trades and setups across the MAG 7.
@thecafetrader
Take care, and happy trading!

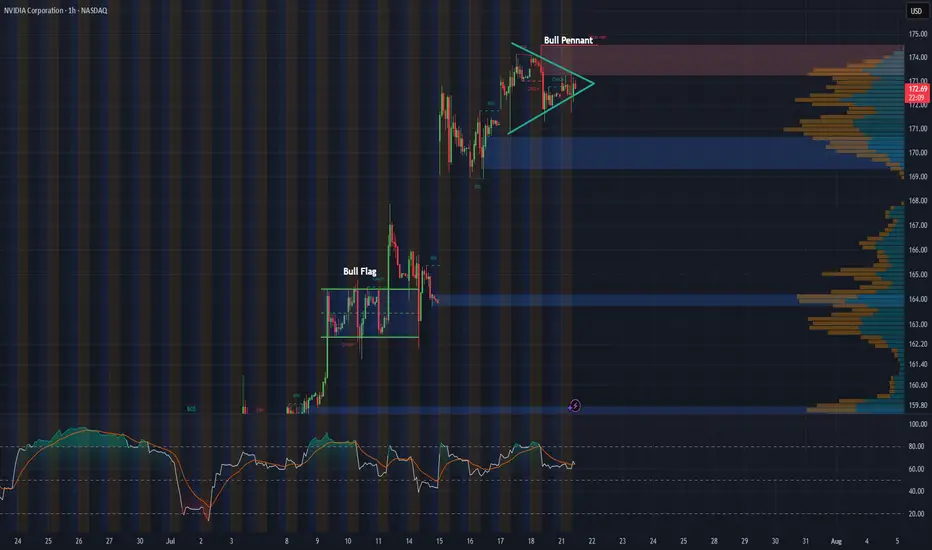
NVDA 1-Hour Chart UpdateHey everyone, just wanted to share a quick update on NVDA’s 1-hour chart. Following last week’s bull flag breakout, the stock appears to be consolidating into what looks like a solid bull pennant formation.
With major tech earnings on the horizon and the recent approval to sell H20 chips to China, this pattern could be setting the stage for another breakout. Will NVDA continue its impressive rally, or is this just a breather before the next move?
$NVDA WEEKLY TRADE IDEA – JULY 21, 2025
💥 NASDAQ:NVDA WEEKLY TRADE IDEA – JULY 21, 2025 💥
🔥 Bullish Options Flow + Weekly RSI Strength = Controlled Momentum Play
⸻
📊 Trade Details
🔹 Type: Long Call
🎯 Strike: $180.00
📆 Expiry: July 25, 2025 (4DTE)
💰 Entry: $0.51
🎯 Target: $1.02 (💯% Gain)
🛑 Stop: $0.20 (~40% Risk)
📈 Confidence: 65%
🕰️ Timing: Monday Open
📦 Size: 1 Contract (Adjust based on risk tolerance)
⸻
📈 Why This Trade?
✅ Call/Put Ratio = 1.48 → Bullish bias confirmed
📈 Weekly RSI = 77.0 → Strong momentum
🔻 Daily RSI = 80.8 (falling) → Short-term pullback risk
📉 Volume = flat (1.0x) → Weak confirmation = tighter risk mgmt
🧠 Strike Clustering: $177.50 & $180 = strong OI zones
🌬️ VIX = 16.7 → Favorable for long premium plays
⸻
⚠️ Risks & Strategy Notes
❗ Daily RSI = caution: short-term exhaustion possible
📉 Weak volume = lack of institutional chase
⏳ Exit before Friday – avoid IV crush and gamma slam
🔐 Set alerts at $178.75 and $179.80 – pre-breakout signals
⸻
🎯 Plan:
• Enter Monday open
• Scale partials if price hits +30–50%
• Full exit by Thursday unless price is breaking through $180 early with strong volume
⸻
🏁 Quick Verdict:
This is a momentum continuation setup, not a fresh breakout.
Play the trend, respect RSI signals, and cut fast if flow dries up.
NASDAQ:NVDA 180C — Risk $0.20 to Target $1.02
Let the call ride… just don’t overstay.
⸻
#NVDA #OptionsTrading #CallOption #WeeklyPlay #MomentumTrade #FlowBasedSetup #TradingViewIdeas #GammaPlay #BullishBias #NVIDIA

NVIDIA: Stay heavy on positionsNVDA position size is adjusted in line with US market signals for underweight or overweight allocations. During panic phases, 2x leverage ETFs are on the table
Stay heavy on positions.

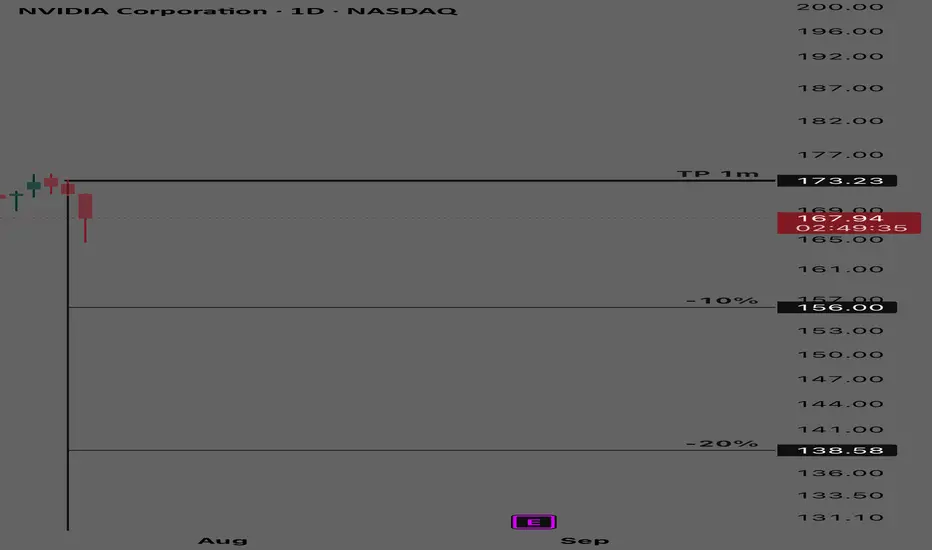
NVIDIA - Short Term Buy CycleNvidia
Short term buy cycle
TP at 173.23
% bubble ratio
Today NVIDIA entered into a short term buy cycle (negative bubble) with fair value at 173.23
Spot trading plan:
Start to buy at (-10% bubble ratio) and below
TP at 173
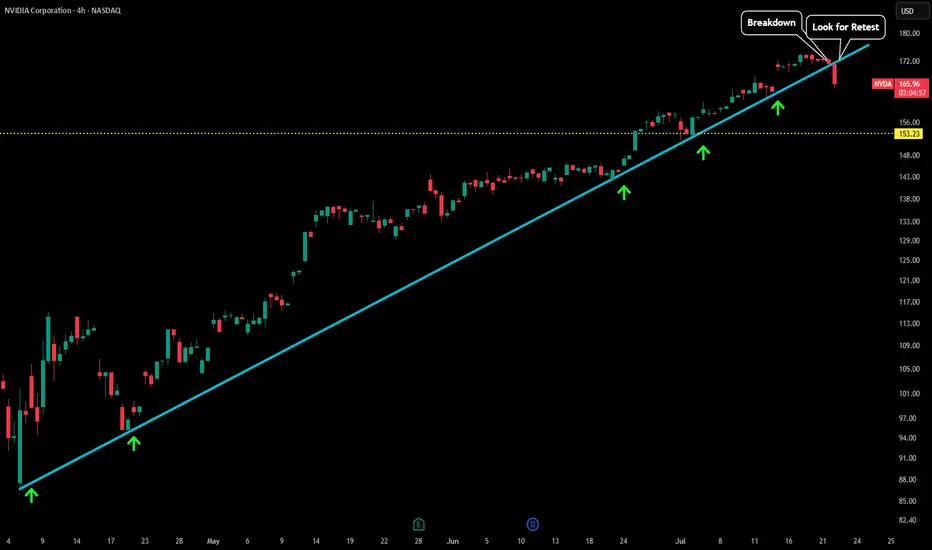
NVDA - LTF Breakdown This is an update to our last post:
After finding support upon this trendline for so many test we are now seeing the first signs of weakness. As soon as price fell below our trendline we saw a very sharp decline in price.
Now that trendline could act as a new level of resistance. Any test back to the upside could be a test of blue trendline as resistance + test of last high (which could create some sort of double top). Will update this post when more developments occur.
$NVDA filled the gap. NASDAQ:NVDA filled the gap on the downside. A lot of bearish flow came in yesterday. But today the flow was bullish early.
NVDA Nearing it's top, When to Buy in?Hi, I’m The Cafe Trader.
This week we’re continuing our breakdown of the MAG 7, and today we’re taking a look at NVIDIA (NVDA) — 2 out of 7 in the group have broken out to new all-time highs, and NVDA is one of them.
⸻
🧠 Analyst Targets
Analyst price targets for NVDA are wide-ranging — some as low as $80, others as high as $250.
The average target is around $180, and NVDA is currently approaching that level.
Buying into strength like this can be difficult, so I’ve prepared a few long-term price zones for those looking to add on dips.
⸻
📈 Long-Term Price Zones to Watch:
• Aggressive Entry Zone: ~$163
This is the top of a developing demand zone. You’ll see some buyer interest here, but that demand extends down toward $144.
• Primary Demand Area: $153–$144
This is where stronger buyers have shown up in the past. It’s a more balanced zone and could act as a key support in any retracement.
• Deep Value Zone: ~$129
If NVDA pulls back this far, this would be my favorite buy level. Anything at $130 or lower would represent what I consider a steal — strong value relative to long-term expectations.
⸻
📊 Follow for more MAG 7 price breakdowns.
Up next: a deeper dive into NVDA for shorter-term swing trades and technical setups.
📍@thecafetrader

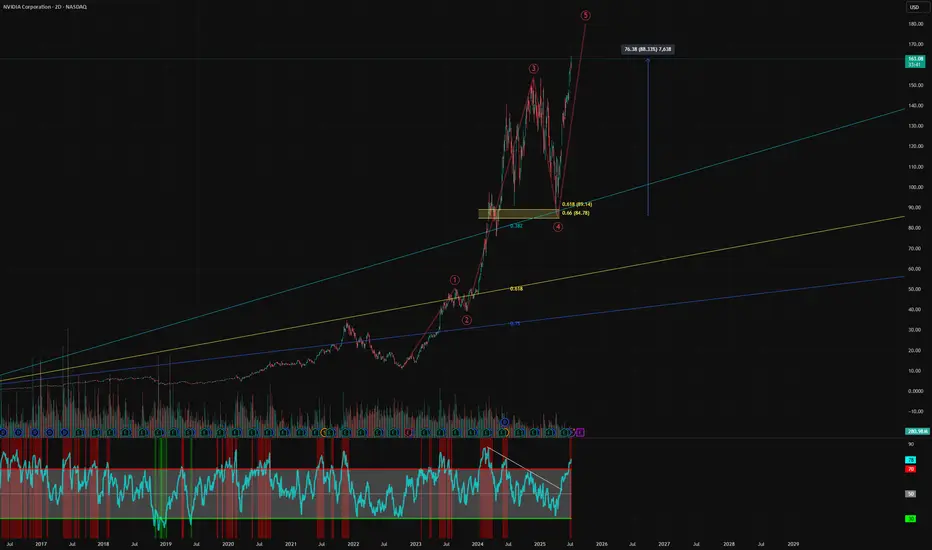
Nvidia - Blow off top?Time to book some AI stock profits, I have exited ARM and today I am taking profits on Nvidia. We entered at the golden pocket, up over 88% since the recent lows. I am now scaling out of my position, starting with 50% of my total. I will use a trailing stop loss for the rest.
We have hit a 4 trillion dollar market cap, more than the entire UK stock market combined. Am I bearish on Nvidia? Of course not, but the market is getting greedy and I like to book profits.
I love the company, but I expect huge volatility going forward.
Not financial advice, do what's best for you.
Nvidia Hits New Highs, But Is the Rally Losing Steam?NVIDIA (NVDA) just keeps climbing in 2025! It's been an incredible run, fueled by insatiable demand for AI technology and a wave of investor optimism. The stock has rocketed to fresh highs, pushing its P/E ratio above 54. That's way higher than what we typically see in the industry, making many wonder if it's getting a bit too pricey.
Now, looking at the charts, NVDA was actually caught in a rising wedge pattern. Think of it like a funnel narrowing at the top – it often hints that a stock might be ready for a pullback. Last week, it seemed to break out of the top of that wedge, which usually signals more good times ahead. But here's the kicker: this breakout happened on weakening momentum. Both the RSI (a measure of how fast prices are changing) and trading volume were telling a different story, showing a divergence that suggests the underlying buying power might be fading.
So, despite this impressive climb, these technical signals are whispering a word of caution. While the overall uptrend is still intact, that fading strength behind the move could mean we're heading for some consolidation or even a short-term pullback. Investors might want to keep a close eye on things and wait for clearer signs before jumping in at these elevated levels.
(Disclaimer : This is not financial advice. Always do your own research)

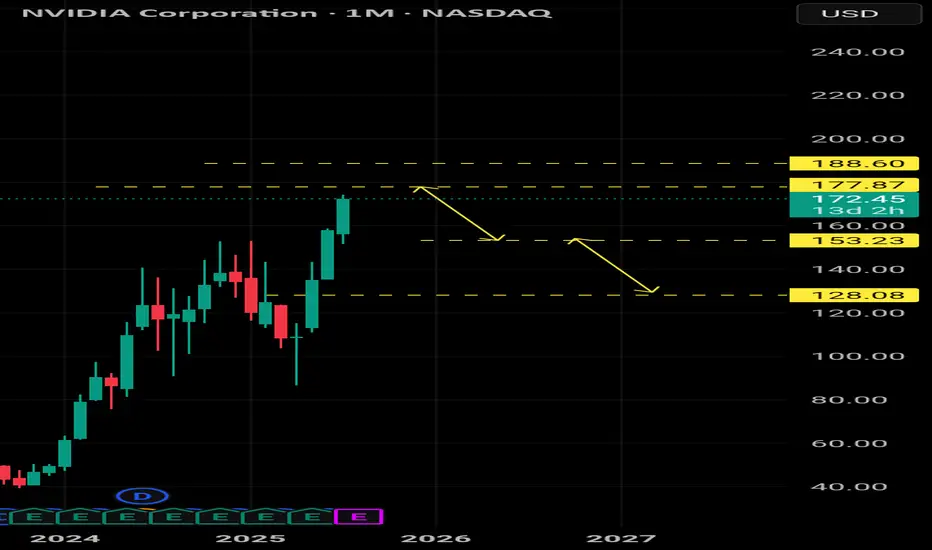
Potential NVIDIA Pullback: Watch These Key SupportsWe might witness a correction on one of the strongest stocks – NVIDIA
The level 177 is a very critical support.
Followed by the level 188 as another key level.
Correction targets are clearly illustrated on the chart in front of you.
Nvidia (NVDA) Share Price Surges Above $170Nvidia (NVDA) Share Price Surges Above $170
Yesterday, Nvidia’s (NVDA) share price rose by more than 4%, with the following developments:
→ It surpassed the psychological level of $170 per share;
→ Reached another all-time high;
→ Gained more than 9% since the beginning of the month.
The bullish sentiment is driven by Nvidia CEO Jensen Huang’s visit to China shortly after meeting with US President Trump. At the same time:
→ US Secretary of Commerce Howard Lutnick stated that the planned resumption of sales of Nvidia H20 AI chips in China is part of the US negotiations on rare earth metals.
→ The head of Nvidia stated that he was assured licences would be granted very quickly, and that a large number of orders for H20 chip deliveries had already been received from Chinese companies.
Market participants are viewing the situation with strong optimism, and analysts are raising their valuations for NVDA shares:
→ Morningstar analysts raised their fair value estimate for Nvidia shares from $140 to $170.
→ Oppenheimer analysts increased their target price from $170 to $200.
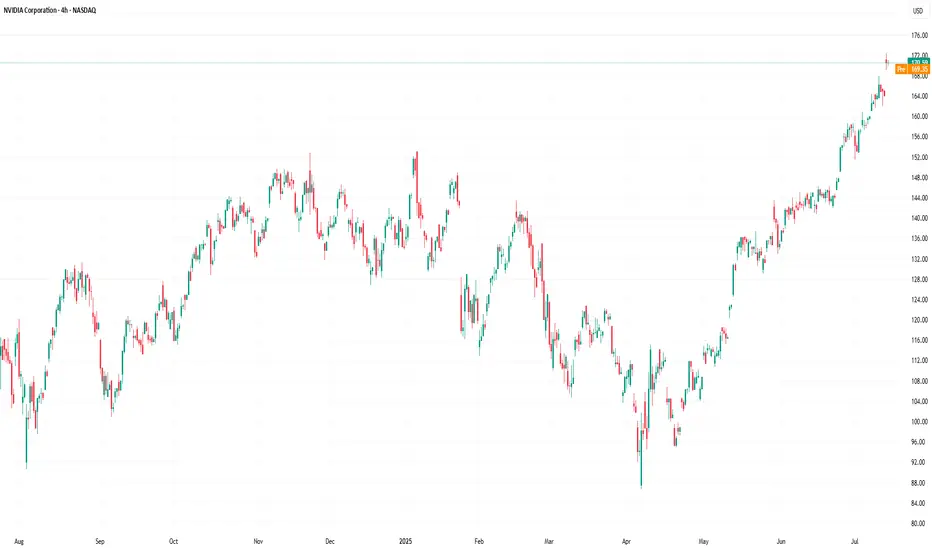
Technical Analysis of the NVDA Chart
The price trajectory of NVDA shares fully reflects the exceptionally strong demand:
→ The price is moving within an ascending channel with a steep growth angle;
→ Since early May, the RSI indicator on the 4-hour chart has not fallen below the 50 level;
→ Yesterday’s trading session opened with a large bullish gap.
The chart also shows the formation of a stable bullish market structure (shown with a purple broken line), expressed through a sequence of higher highs and higher lows.
Given the above, it is difficult to imagine what might cause a sharp shift from positive to negative sentiment. If a correction begins (for example, with a test of the $160 level), traders should watch for signs of its completion — this could present an opportunity to join the emerging rally.
This article represents the opinion of the Companies operating under the FXOpen brand only. It is not to be construed as an offer, solicitation, or recommendation with respect to products and services provided by the Companies operating under the FXOpen brand, nor is it to be considered financial advice.