Pfizer INC (SELL)After several rejections of the trend line and a head and shoulders shoulder, Pfizer breaks the trend line and we expect a very probable fall after a possible pull-back.
Stop loss : 52. 40
Take profit : 31.37
PFE trade ideas

Symmetrical TrianglePrice has broken the bottom trendline of the triangle.
No recommendation.
There is also a bearish Rising Wedge below price.
Pfizer Might Be Feeling SicklyBig pharma names like Pfizer have held up better than most parts of the market, but now the Dow member might be feeling sickly.
The main pattern on today’s chart is the series of higher lows since March 2021 and lower highs since December. These converging trendlines have produced a triangle that PFE appears to have broken to the downside.
Attention could now focus on the April low of $47.12 because a close below that level would represent a lower low.
Next, PFE bounced at its 200-day simple moving average (SMA) in early March and early May. However, this month it ripped through the SMA without a pause. Has it lost relevance as support?
Finally, the stock made a higher high and lower low on the weekly chart: a bearish outside candle.
TradeStation has, for decades, advanced the trading industry, providing access to stocks, options, futures and cryptocurrencies. See our Overview for more.
Important Information
TradeStation Securities, Inc., TradeStation Crypto, Inc., and TradeStation Technologies, Inc. are each wholly owned subsidiaries of TradeStation Group, Inc., all operating, and providing products and services, under the TradeStation brand and trademark. You Can Trade, Inc. is also a wholly owned subsidiary of TradeStation Group, Inc., operating under its own brand and trademarks. TradeStation Crypto, Inc. offers to self-directed investors and traders cryptocurrency brokerage services. It is neither licensed with the SEC or the CFTC nor is it a Member of NFA. When applying for, or purchasing, accounts, subscriptions, products, and services, it is important that you know which company you will be dealing with. Please click here for further important information explaining what this means.
This content is for informational and educational purposes only. This is not a recommendation regarding any investment or investment strategy. Any opinions expressed herein are those of the author and do not represent the views or opinions of TradeStation or any of its affiliates.
Investing involves risks. Past performance, whether actual or indicated by historical tests of strategies, is no guarantee of future performance or success. There is a possibility that you may sustain a loss equal to or greater than your entire investment regardless of which asset class you trade (equities, options, futures, or digital assets); therefore, you should not invest or risk money that you cannot afford to lose. Before trading any asset class, first read the relevant risk disclosure statements on the Important Documents page, found here: www.tradestation.com .

PFE - Pfizer Inc. - LongPfizer Inc. is an American multinational pharmaceutical and biotechnology corporation headquartered on 42nd Street in Manhattan, New York City. The company was established in 1849 in New York by two German immigrants, Charles Pfizer and his cousin Charles F. Erhart.
We may feel better after the vaccinations. However, globally, the pandemic has no signal of ending. Expecting more booster shots and treatment pills. Going long here.
PFE, KO - Very Strong Monthly ChoicesFor anyone looking for a long position in their portfolio (Monthly) Pfizer and Coca-Cola Hodl great potential in their current state
Pfizer has formed a bullflag above the Gaussian Channel
Coca-Cola is very similar above the Channel, however lacking the bullflag
For Coca-Cola check out my previous post below

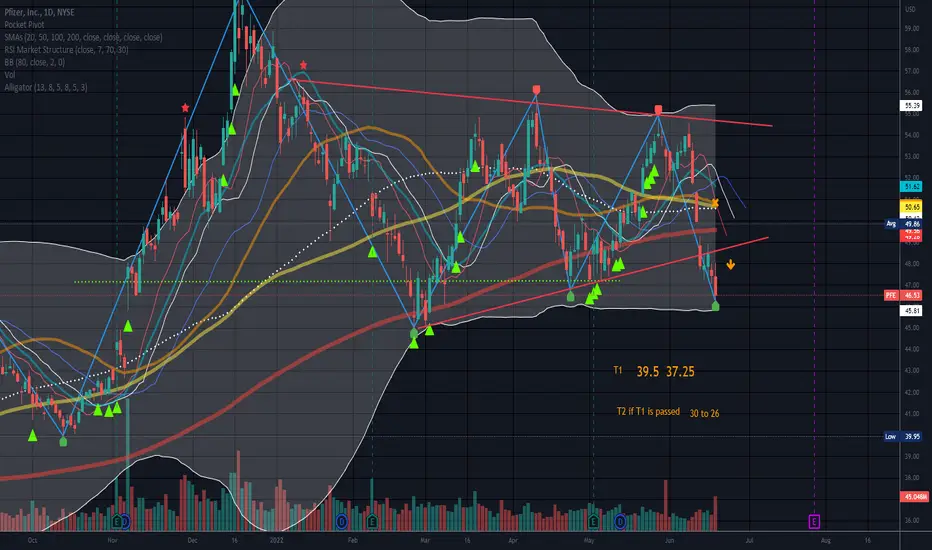
PFEBought a small quarter position as its acting very well from a test to the 50 day inside a VCP pattern.
Position 8K, another 1.5% increase in exposure, now 21% overall invested.
Avg Cost: 53.35
Stop: 50
Risk: 6.28% (500 USDs-->quarter of "aggressive").
Market is correcting but my portfolio is on the green and my pilot stocks are holding ok. The 55 area is a key area of resistance.

PFE long, pullback to value zoneSwing trade idea for PFE. PFE is making HH-HL on weekly. And on daily dipped to the Jlines. Enter on 1h hour trigger. Risking below Jlines on hourly.

Pfizer in a Bullish patternPfizer seems to be in a bullish pattern as indicated by the bullish BAT pattern. Also this has been confirmed by green candles on Heiken with two days consecutive gains. In addition price has moved above the fib level of 38.2% and the trend line resistance which is an indication that we have a solid support at this point. Target at fib level of 61.8% which is 53.75. That accumulates around 7 percent profit. Stop loss according to the risk reward ratio.

Pfizer at resistancePfizer
Short Term - We look to Sell at 54.62 (stop at 56.31)
Bespoke resistance is located at 54.70. A move higher faces tough resistance and we remain cautious on upside potential. Selling spikes offers good risk/reward. Further downside is expected although we prefer to sell into rallies close to the 54.60 level. Trading has been mixed and volatile.
Our profit targets will be 49.84 and 46.85
Resistance: 54.70 / 56.32 / 61.71
Support: 50.00 / 47.50 / 40.94
Disclaimer – Saxo Bank Group. Please be reminded – you alone are responsible for your trading – both gains and losses. There is a very high degree of risk involved in trading. The technical analysis, like any and all indicators, strategies, columns, articles and other features accessible on/though this site (including those from Signal Centre) are for informational purposes only and should not be construed as investment advice by you. Such technical analysis are believed to be obtained from sources believed to be reliable, but not warrant their respective completeness or accuracy, or warrant any results from the use of the information. Your use of the technical analysis, as would also your use of any and all mentioned indicators, strategies, columns, articles and all other features, is entirely at your own risk and it is your sole responsibility to evaluate the accuracy, completeness and usefulness (including suitability) of the information. You should assess the risk of any trade with your financial adviser and make your own independent decision(s) regarding any tradable products which may be the subject matter of the technical analysis or any of the said indicators, strategies, columns, articles and all other features.
Please also be reminded that if despite the above, any of the said technical analysis (or any of the said indicators, strategies, columns, articles and other features accessible on/through this site) is found to be advisory or a recommendation; and not merely informational in nature, the same is in any event provided with the intention of being for general circulation and availability only. As such it is not intended to and does not form part of any offer or recommendation directed at you specifically, or have any regard to the investment objectives, financial situation or needs of yourself or any other specific person. Before committing to a trade or investment therefore, please seek advice from a financial or other professional adviser regarding the suitability of the product for you and (where available) read the relevant product offer/description documents, including the risk disclosures. If you do not wish to seek such financial advice, please still exercise your mind and consider carefully whether the product is suitable for you because you alone remain responsible for your trading – both gains and losses.

Pfizer:Pure Technical Play!Pfizer
Short Term - We look to Sell at 53.30 (stop at 55.53)
Price continues to trade within the triangle formation. A move higher faces tough resistance and we remain cautious on upside potential. Selling spikes offers good risk/reward. Further downside is expected although we prefer to sell into rallies close to the 53.56 level.
Our profit targets will be 48.29 and 43.36
Resistance: 53.56 / 56.32 / 61.71
Support: 47.50 / 45.44 / 40.94
Please be advised that the information presented on TradingView is provided to Vantage (‘Vantage Global Limited’, ‘we’) by a third-party provider (‘Signal Centre’) . Please be reminded that you are solely responsible for the trading decisions on your account. There is a very high degree of risk involved in trading. Any information and/or content is intended entirely for research, educational and informational purposes only and does not constitute investment or consultation advice or investment strategy. The information is not tailored to the investment needs of any specific person and therefore does not involve a consideration of any of the investment objectives, financial situation or needs of any viewer that may receive it. Kindly also note that past performance is not a reliable indicator of future results. Actual results may differ materially from those anticipated in forward-looking or past performance statements. We assume no liability as to the accuracy or completeness of any of the information and/or content provided herein and the Company cannot be held responsible for any omission, mistake nor for any loss or damage including without limitation to any loss of profit which may arise from reliance on any information supplied by Signal Centre.

Bullish PIN-PAR The price failed to break the uptrend and a positive Pin Bar candle was formed that gives us an idea that the price will rebound to (target1=51.35; target2=53.90

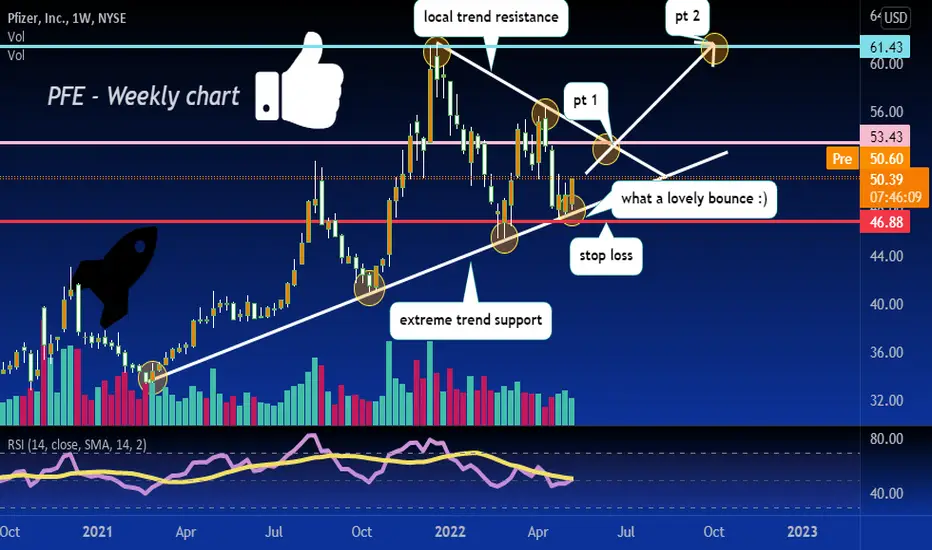
another bounce :)perfect bounce off extreme trend support on PFE ! looking for a rally to 53.43-61.43
$PFE with a Bullish outlook following its earnings #Stocks The PEAD projected a Bullish outlook for $PFE after a Positive Under reaction following its earnings release placing the stock in drift A with an expected accuracy of 100%.


$PFE Call Sweeps and ER next week hmmmPfizer has ER next week and 5/20 calls sweeping today
Technically it looks like we can get a run up to ER , as PFE is at trendline support and possible "fill out" of the triangle pattern
Any run up will capture some gains, will trim position and leave a few runners for ER.
Sweeps were 55.5 and 57 strike which are pretty far out the money, worth noting. Could just be a traders Lotto on $37K of premium (must be nice haha)
Cheers


PFEDaily Chart
PFE sitting right at trend line support. If it breaks support could see a potential drop to 43 level. If it bounces from the trend line it would head to 52 level. Earnings coming out May3 pre market so that would be a catalyst for the direction.

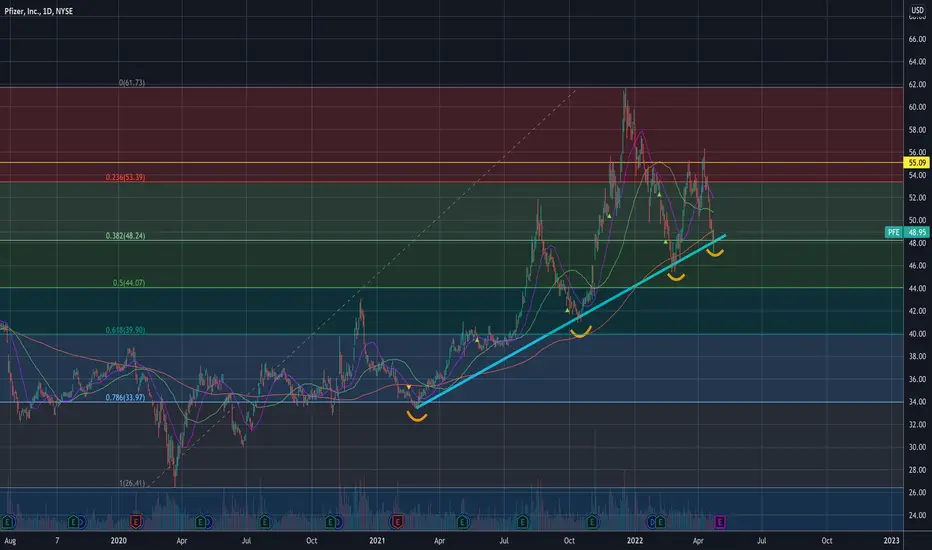
$PFE - Possible trendline bouncePfizer checked back on the up trendline that started since March 2021 at around $47 area. Moreover, the trendline check back area coincides with the 0.382 fib retracement. The trendline has acted a strong support prior 3 times and could provide support again this time. However, there is a possibility of revisiting $44 before reversal happens.
Target 1 - $53
Target 2 - $55
Target 3 - $61
Risk - Can see $44 first before a reversal.
I started a position and with a plan to double when I see $44.
———————————————————
How to read my charts?
- Matching color trend lines shows the pattern. Sometimes a chart can have multiple patterns. Each pattern will have matching color trend lines.
- The yellow horizontal lines show support and resistance areas.
- Fib lines also show support and resistance areas.
- The dotted white lines show the price projection for breakout or breakdown target.
Disclaimer: Not investment advice.
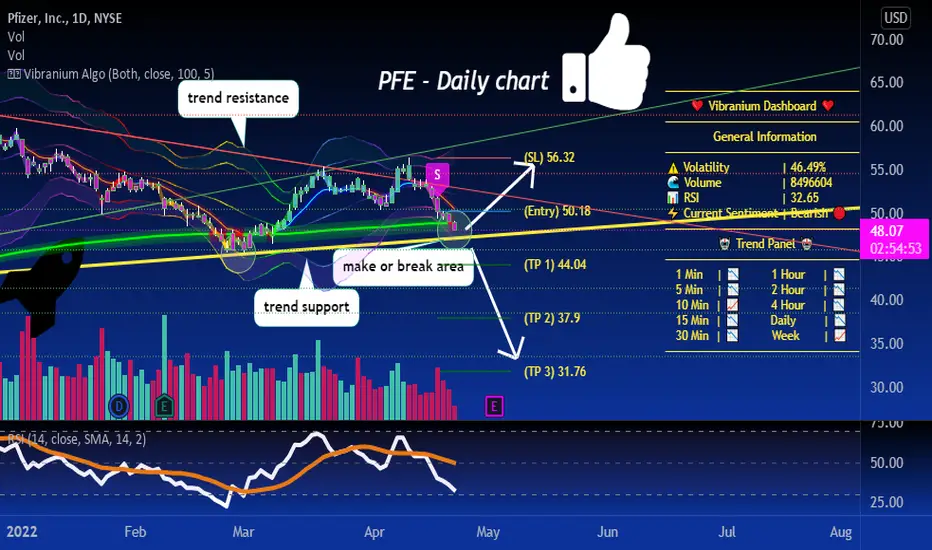
PFE at make or break it area.. >.<If it cannot hold this trend support we dump to 44.04-37.9-31.76, a bounce can send it back to 56 resistance.
considering all its competitors dumped backed to lows... i think its possible we do the same here.
$PFE Key levels, Analysis & TargetsPFE Key levels, Analysis & Targets
Price to down " Wave C "
Target Fibo = 61.8 - 88.7%

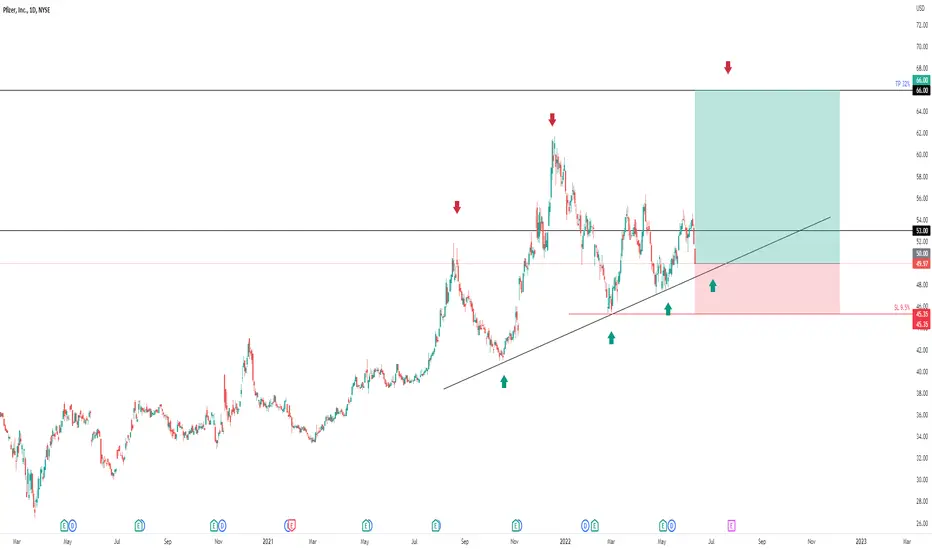
$PFE: Big weekly trend setting up...I think $PFE offers a tremendous opportunity here, good setup to enter a position with low risk vs reward potential. Could be a long term position as well, depending on how it evolves.
I'm long 12.07% here, risking a 3 times the daily ATR move against me for a 1% loss if it drops that much. Valuation is attractive and long term charts have a huge setup in $PFE, the big correction as of late seems to be over, and it's ready to go steadily up again.
Best of luck,
Ivan Labrie.

PFE on Elliott wave 3One could have opened positions when price hit 50% down from wave 1, which is part of the Fibonacci Ratio Relationship rule. However, it could have dropped further to 61.8%, 76.4%, or 85.4%, being part of that rule.
So, being firmly on wave 3, being the longest of 1-3-5, I chose to wait for the breakout at price of $51.88. It was really close yesterday.

R H&S pattern PFE R H&H formed , It will be bullish if it breaks the neck line.
Entire health care sector is bullish.
