PG trade ideas

Break below $80 support brings more pain aheadP&G is showing weak relative strength in a weak sector (Consumer Staples) and just broke below a key $80 support level. This is likely to bring more pain ahead for this stock as it pulls back spending on weaker revenue growth. Use options to limit your risk such as Put Vertical debit spreads.
Register for a free 30 Trial to OptionsPlay !

PG in s/r bandPG could be a longer term long with it being in the s/r band. It looks to be a getting some buyers in this area.
Entry: 80ish
Stop: 75ish (under s/r band)
Target: 90.79


PG Daily bullish bat patternWhen the market start to fluctuate and I am still bullish on the market,
often times I'll turn to consumer goods sector to look for trading opportunities.
When the market remains good, they may go with the trend; when the market encounters headwind , they hurt less.
I'll look for reversal sign in front of 86.00 and put the out below 85.00 or even lower (as we don't really need to risk that little in such a name though)
Let's see how it goes!


PG time to go LONGPlaying Trading Simulator Game:
One of the most active options traded on Wednesday 17JAN18.
95% of them were calls.
Watch for entry between 10:15 and 11:15

The current position of the symbolThe current position of the symbol (support and resistance ahead)
Without forecast

MACD IndicatorIn the graphic above, is shown how the MACD indicator works, there are two lines of different colors, one of them is blue which represents the difference between two exponential moving averages, one of 12 periods and the other of 26 periods; while the orange line, also known as the signal line, represents the 9-period exponential moving average of PG prices -0.15%.
This indicator sends orders to buy and sell the shares acquired to hold a position, either long or short term, depending on the behavior of the moving averages used, at the moment when the blue line crosses the orange line above it, a Short-term operation is executed. in case of the opposite, a long position will be assumed.
For the case shown, having applied the MACD for that period of time, a profit would have been obtained, since only a small loss was taken in the fluctuation of the share price.

Down TrendlineA line built on successive peaks, each with a lower maximum than the previous one, thus forming a clear descending line passing through the maximum of each peak


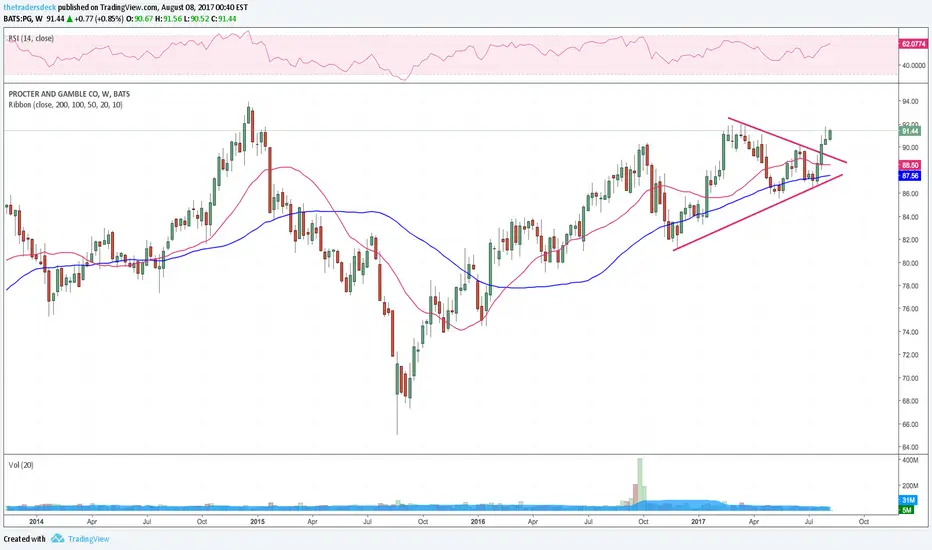
Stocks that have raised dividends for at least 25 Years11-18-17 – PG – On the daily PG has been trending upward since September 2015. Recently, it put in a high in sept 2017 and has failed to make a higher high. The stock has also made an equal low at 86ish which it had traded at in Jan, May, and July. The stock bounce of that area at the beginning of Nov. At the Moment, short-term, we need to see what it is going to do. We are in an area where it is best to sit on our hands and not try to guess the direction of the trade. If PG breaks the 86ish area the next target would be 83.50ish and then 81ish. On a Longer-term weekly chart, we are clearly bullish and has actually created a Higher high of 94.67 on 9/18/17 vs 93.89 on 12/22/14. I would like to own this stock at a lower price since it is trading near the highs, so we may want To wait for a pullback if we were trying to time the market a little better. Since Procter & Gamble is among the world's largest consumer products companies We can expect this company & stock, typically, to stay relatively stable in a down economy and stock market. PG has raised its dividend annually for 60 years in a row. Dividend & Yield is 2.76 (3.09%)

PG at SupportI was too early on my first go at PG bouncing off of this strong support level. I should have taken note of the bear strength that drove price downward and anticipated some sort of pull back and retest.
The bear pressure has since rounded out and we've got a nice swing-low, deep in the support area. The swing-low candle itself was a hammer, followed by a decently bullish day, making for a convincing little pattern that price may finally be ready to turn around.


#PG - Possible Cypher ?Hi
I'm new here and rather new to trading.
My intention is to post possible trade setups based on harmonic patterns.
Any feedback is much appreciated - trying to learn!!
Could this be a possible Cypher setup?


Failure to breakout to new highWith the failure of new highs, I'm looking for a completion of bigger ABC correction.

Simple S/R Strategy: Trade #5 - PGNailed this with PaperMoney the last time it bounced off of this support. PG beat earnings on the 20th so just waiting for another reversal.
If triggered in, I'll determine how long I intend to be in this trade at that point.


PG trading strategyPG on the hotspot and it gave an inside day yesterday, in terms of investment, we should actually avoid these hotspots and news names;
while in terms of trading , we look for fluctuation to trade!
Short-term plan for today is the inside day, if it's able to break 91.80 today, it might be a good news pull back to long this consumer product giant;
If it breaks the downside, it could be the continuation trade for the 90.00 breakdown.
That's why I recognize it as a both sided trade.
1:1 1st kick and strict risk-reward stop are MUST of course!
In larger time frame, the bullish bat pattern can be a better long if it's able to give reversal sign there.
Let's see how it goes!