RivianIf it breaks the 18 the next target will be 23, the 18 is an annual resistance, it is quite strong if it does not succeed it will continue in more range
RIVN trade ideas

Quick View: $RIVN- Test on the ema 50 Daily looks good and a new bullish crossover on the hourly timeframe.
- The last pullback didn't have volume, so a continuation higher is on watch

Rivian Kicking Off Potential UptrendHey, all. I'll get down to it. Obviously NASDAQ:RIVN has been an incredibly tough stock to own. Fake out after fake out. It has been brutal - unless you have been nimble enough to buy the dips and sell the rips.
I would like to posit, however, that NASDAQ:RIVN is going to start marching back higher here over time. In the signal system I have been taught via the T@M strategy, Rivian is putting in a range expansion to the upside on the weekly time frame. If you take the range of the past monthly consolidation period, attach it to the "mode" (or central zone of the consolidation range), it gives you a target of $25 over the next few months. Now, whether this is another fake out just to reverse on us... again... remains to be seen of course. It is early in the idea. But potentially offers a decent risk/reward position here.
I just do not see Rivian really going away at all and, if they can keep refining their business, they could see some success going forward. Anyway, hope you enjoy this idea! As always, position carefully as the market is risky business.
Including the Daily Chart below for your reference as well.

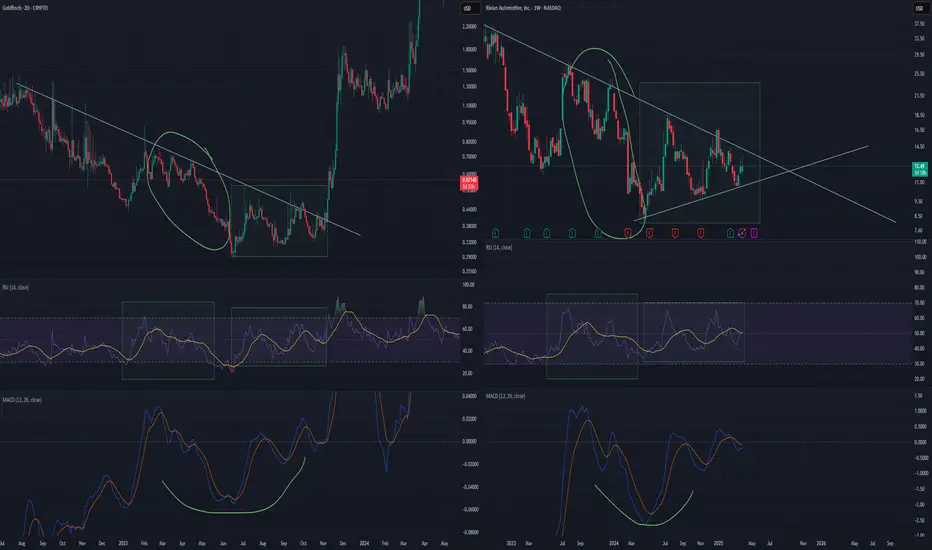
Thanks to Elon, RIVN is the new GME and GoldfinchFirst off, hats off to our politicians in office who are making this happen. When in history did you ever have both a president AND ceo butcher their company so hard that the 2nd option - RIVN - gets a god candle after a multi year breakout.
Tesla fan boys all say - never short tesla- and let me tell you, that only works if people expect it to drop. The whole long term picture is true, but for a long term hold, you have infinite time to buy in the short run. Those guys will love tesla a lot more at 100 than at 300.
I dont hate Elon. I like him, except Trump just proved to us what his motives are. Elon is a genius who will face an uphill short term battle with the horde of politicians. Wish him best of luck. In mean time my money is in RIVN. Lets go boys. and for the record, last year my money was in Tesla, back when you had a CEO focused on his company.

$RIVNAs China opens rare earth metal exports to the U.S., don’t be surprised if NASDAQ:RIVN becomes one of the chosen buyers.
EVs need those minerals.
China needs the leverage.
America needs the supply.
It’s not just about cars it’s about control of the tech race. 🔋🌍
#RIVN #EV #China #RareEarth #SupplyChain #Geopolitics #ElectricVehicles

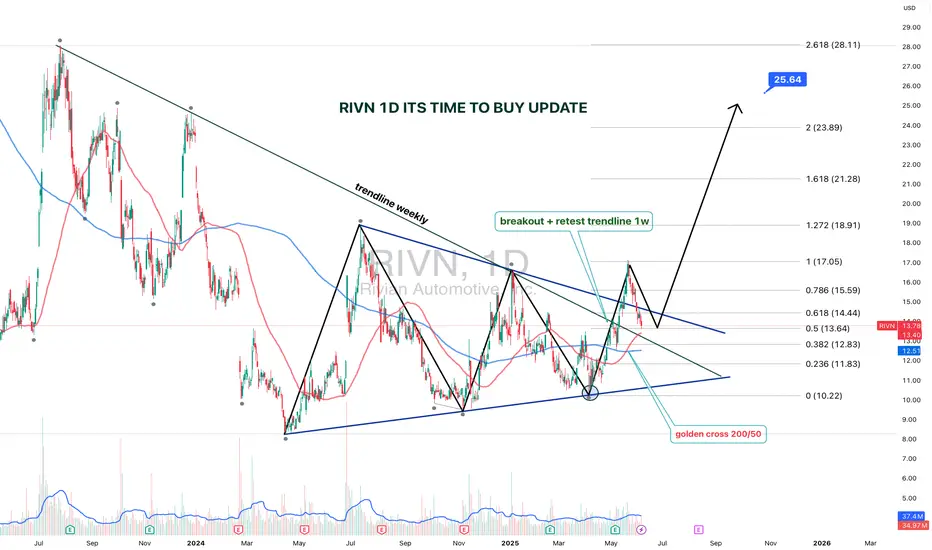
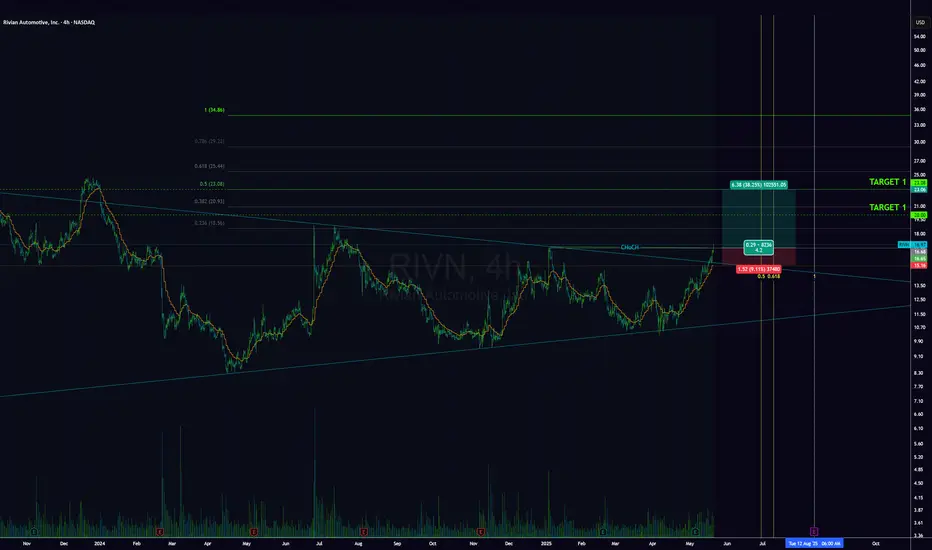
RIVN 1D — It’s Time to Buy: Setup UpdateThe setup on Rivian (RIVN) just got upgraded from “interesting” to “strategically significant.” We’re looking at a textbook symmetrical triangle that’s been developing since July 2023, with a clean breakout and retest on the weekly trendline.
The breakout was followed by a bullish retest, right at the intersection of the triangle base and the key trendline. Volume kicked in, price held — and that’s what smart money calls confirmation.
Now, the Golden Cross is live: the 50-day MA just crossed the 200-day MA from below. Price is confidently holding above both — momentum is shifting hard. Fibs from the bottom (10.22) to the last local top (17.05) project the first target at $17, and the extended Fibonacci confluence gives us $25.64 as a long-range goal (2.618 extension).
The weekly trendline — which acted as resistance for over a year — has flipped to support. Price action respects it, bulls are loading, and structure is clean.
This is not just a bounce. It’s a technical rotation from accumulation to expansion.
The time to talk about potential is over — price action has spoken.
RIVN - Consolidation or break and retest?While the last run was nice for some trades, I am looking forward to this as one of my few longer term spec stocks.
I didn't expect the sell off to happen so fast, then the debt news, almost like daily sell programs were running.
With the news drama and politics, I can see it take another leg down by next week, and has a good chance of bouncing pretty strong, if tesla catches a bid soon, it may help.
I am adding leap options to trade the range as it appears.

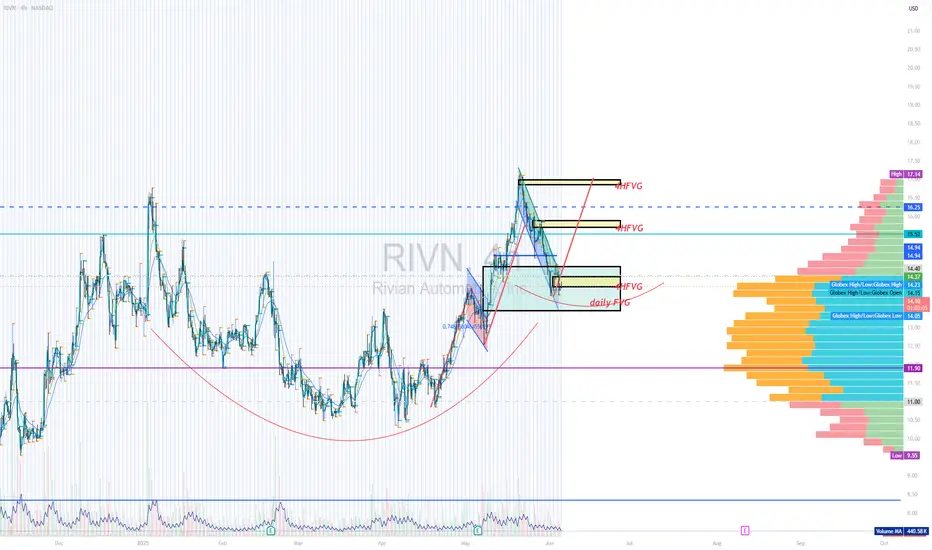
RIVN TESTlong RIVN on Flag formation inside CUP/HANDLE, consolidating at daily FVG, with upside 4h FVG. Long exposure August $17 strike.
LevelsFrom December 2024, the price been dancing in upward parallel channel. Now it is testing the middle of that channel and the 50 EMA(in purple) and 0.5 Fib level and interestly enough the 200 EMA(in orange) is near the Golden zone also. If price makes a strong move into the 14.55 the 0.382 Fib area, there is a chance of bullish action; but if price breaks below with conviction under the 50 EMA we might have a battle at the golden zone 12.97, the 200 EMA 13.10.

RIVIAN: Same Setup?NASDAQ:RIVN Historically, RIVN’s rallies have lined up with summer delivery updates, EV hype cycles kicking in, and broader market rotations into speculative growth 100%+ in 2023, 100%+ in 2024. This year it’s setting up again , both spikes came after strong volume in May and were followed by multi-week momentum through June. Feels like that rhythm’s trying to repeat. We’ve got a clean BOS, volume confirmation, and structure matching up. If buyers defend this zone again, this could be the third summer in a row Rivian runs. Watching it close.

RIVN Breaking out of down trend - retestI haven't shared in a while as the market structures have been too choppy.
Rivian seems to be bucking the trend of the overall market based on light speculation on new models, and technicals forming a longer term down trend break to upside.
I'm looking at this 3 day pull back as a perfect retest of the break. If it holds, I will add more to trade the range once it forms.

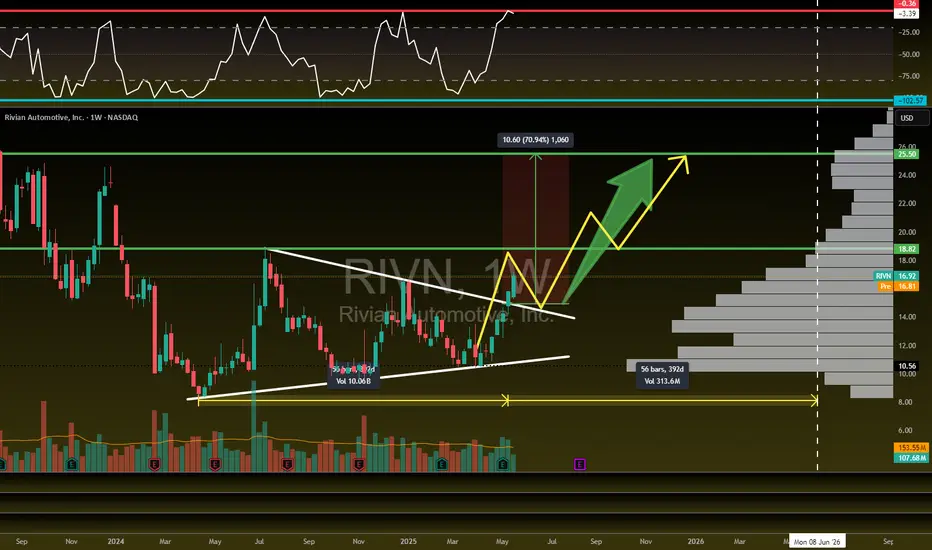
Rivian is flying! 71% UpsideNASDAQ:RIVN is flying! ✈️
Looking for a pullback to retest our breakout then move higher to our profit targets...Posted this setup last week in the community.
🎯$18.82📏$25.50
- Bullish H5_L Indicator
- Running into Red barrier (Need WCB to form)
- Volume shelf launch
$RIVN finally trendingI guess NASDAQ:RIVN made a longterm bottom, a monthly trend is active, glad to check it in a few months.

RIVN LONGGreat Earnings, Technicals seeing nice volume into a CHoCH, after many months watching this ticker. Breaking out, Id like to see $23+
RIVIAN is ready to breakout, $25 TargetRivian has been in the dumps ever since it cratered from its IPO price, and today just under a 90% discount it is looking to start it's recovery off the back of 2 successful earnings reports while inching steadily towards a positive EPS.
I drew a symmetrical triangle (its a little off symmetry but its close enough) and we broke out of it yesterday and today closed firmly above the downward trendline.
One of the things I look at is the bottoming periods of the triangle, in this case each bottom was higher than the previous (slightly) this is required for a triangle breakout, but it is important to see that 4 missed earnings did not result in the stock making a lower low, also it is important to see that the liberation day market sell-off did not make a lower low, despite the headwinds the lows kept creeping up. To me this indicates that there is solid support and accumulation.
With EV hype picking up with TSLA I think we may see RIVN take off among investors who don't feel like backing the Musk project that want to capture a similar market.
Based just on the the price to sales ratio, I feel that Rivian is undervalued compared to its competitors.
Tesla Price to Sales: 50
Lucid Price to Sales: 35
Rivian Price to Sales: 15
This comes together to make me confident in Rivian being a solid bet as the market begins to turn bullish in the summer months and as the SNP500 moves on to making new highs in the coming months.
Just my opinions.
Good Luck & Happy Trading
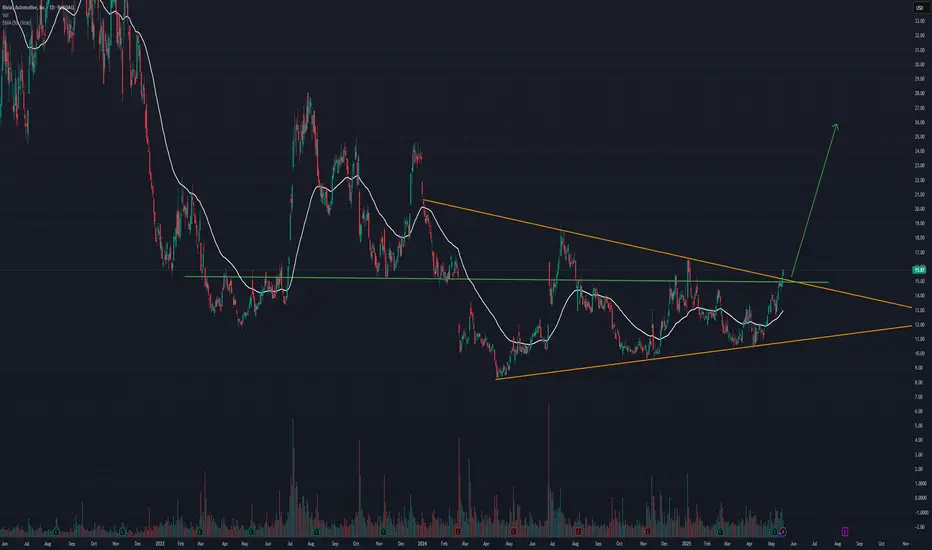
RIVIAN Huge 1-year Triangle about to break. Trade the break-out.Rivian Automotive (RIVN) is trading within a 1-year Triangle pattern since the April 15 2024 Low. Right now the price is on the 1W MA100 (green trend-line), almost hitting the top (Lower Highs trend-line) of the pattern.
This is the second time ever that the 1W MA100 is tested, the previous on was on the last Lower High in late December 2024, giving slightly more probabilities for a bullish break-out above it.
If this is materialized, buy the break-out and target the 2.0 Fibonacci extension on the long-term at $26.50.
If it fails to break and instead is rejected back towards the Triangle's bottom, wait for a confirmed break of the Higher Lows trend-line and sell towards the -1.0 Fibonacci extension at $6.50.
-------------------------------------------------------------------------------
** Please LIKE 👍, FOLLOW ✅, SHARE 🙌 and COMMENT ✍ if you enjoy this idea! Also share your ideas and charts in the comments section below! This is best way to keep it relevant, support us, keep the content here free and allow the idea to reach as many people as possible. **
-------------------------------------------------------------------------------
💸💸💸💸💸💸
👇 👇 👇 👇 👇 👇

Tim's Fundamental View LayoutHere is the way that I view any stock for an initial analysis to get an idea of what the market is valuing and viewing the company.
I first look at the free cash flow, so that is directly under the price chart. Free cash flow is the life-blood of the company and can be used to pay dividends and to reinvest in the company to grow the top line or to buy back stock.
Next I look at the PSR or Price-To-Sales-Ratio. This ratio is paramount for me since the top line shows up first for companies and is the starting point for analysis. Companies with low or no sales growth get priced very differently from companies with high growth. Start with sales growth in your analysis. There are many great books on the topic written by Kenneth L. Fisher, the creator of the tool.
Next "Avg Basic Shares Outstanding" to see if the company is constantly diluting investors and raising capital or hiding expenses by giving out stock options each year. Old companies in slow growth industries tend to buy back stock and growth companies grow shares outstanding and is a strong headwind for investors.
Next is "Long Term Debt"... which is another extremely important variable to look at with any company. In the long run, debt is the cheapest capital since you can pay it off cheaply but it can also drag down a company when the future is uncertain and unpredictable. Companies with predictable sales and growth often load up on debt which enhances returns for equity owners, but increases the risk long term. Jet Blue NASDAQ:JBLU is case in point for this as in 2000 before the pandemic it had a $5 billion market cap with $1 billion in debt and now it has over $8 billion in debt and the market cap is down to $1.5 billion. It is very difficult to get out from under such a heavy debt load. Debt can be "death" for any company if overused.
Next is "Revenue" graphed annually. Essential to see if inflation impacts sales growth or if it can't keep up with inflation. The last 5 years was between 20%-50% inflation depending on the industry so if a company doesn't have higher revenues by at least 20% since 2019, then this reveals a weakness in their pricing power which is a very competitive market with likely declining or low margins.
Last is "Market Cap". It is always good to know the market capitalization of any stock that you own. It is the foundation for understanding if any investor would ever want to buy the whole company and what would it cost to buy it and what are the "returns" from owning the whole company.
I hope you can copy this layout for your own so you too can have a one-page view of the history of a company to help you get your mind around its valuation and potential along with understanding the risks all in one, easy picture.

Short RIVN before earnings that show further lossesShort and wait to short again until company is profitable

Is the trend changing for Rivian?NASDAQ:RIVN 's stock price, which has dropped by nearly 80% since September 2022, has started to move upward again in November 2024 with renewed demand.
The possibility of retesting the trendline formed during the 2022-2024 period has strengthened with the demand seen in the past month.
If this upward movement continues, the initial price target could be $19. Should the trend persist, price movements could extend to $28 and even $41.

Trading idea - Entry point > 12.24/61.80%Trading Idea
1) Find a FIBO slingshot
2) Check FIBO 61.80% level
3) Entry Point > 12.24/61.80%
Chart time frame: D
A) 15 min(1W-3M)
B) 1 hr(3M-6M)
C) 4 hr(6M-1year)
D) 1 day(1-3years)
Stock progress: A
A) Keep rising over 61.80% resistance
B) 61.80% resistance
C) 61.80% support
D) Hit the bottom
E) Hit the top
Stocks rise as they rise from support and fall from resistance. Our goal is to find a low support point and enter. It can be referred to as buying at the pullback point. The pullback point can be found with a Fibonacci extension of 61.80%. This is a step to find entry level. 1) Find a triangle (Fibonacci Speed Fan Line) that connects the high (resistance) and low (support) points of the stock in progress, where it is continuously expressed as a Slingshot, 2) and create a Fibonacci extension level for the first rising wave from the start point of slingshot pattern.
When the current price goes over 61.80% level , that can be a good entry point, especially if the SMA 100 and 200 curves are gathered together at 61.80%, it is a very good entry point.
As a great help, tradingview provides these Fibonacci speed fan lines and extension levels with ease. So if you use the Fibonacci fan line, the extension level, and the SMA 100/200 curve well, you can find an entry point for the stock market. At least you have to enter at this low point to avoid trading failure, and if you are skilled at entering this low point, with fibonacci6180 technique, your reading skill to chart will be greatly improved.
If you want to do day trading, please set the time frame to 5 minutes or 15 minutes, and you will see many of the low point of rising stocks.
If want to prefer long term range trading, you can set the time frame to 1 hr or 1 day.

Rivian's Revival Rivian seen a great loss of value for a number of years but I think it is time to reconsider Rivian. I expect Rivian to rise in the coming 2,3 maybe 5 years from now to a new all time high!

$700 incoming for RIVN. Blow it up.Guys this is not even funny. Risk to reward is literally out of this world.

Thank you Elon for Pumping RIVN to the MoonGuys, hold on to your pants. This one will crack the earth soon.