SBUX H&Son the weekly there is a trendline that seems to be in trouble, here it looks like an H&S, I await neckline and mm, the technical changes seem to be there, perhaps it also corresponds to a resistance given by the previous trend and a gap of Nov 2020
SBUX trade ideas

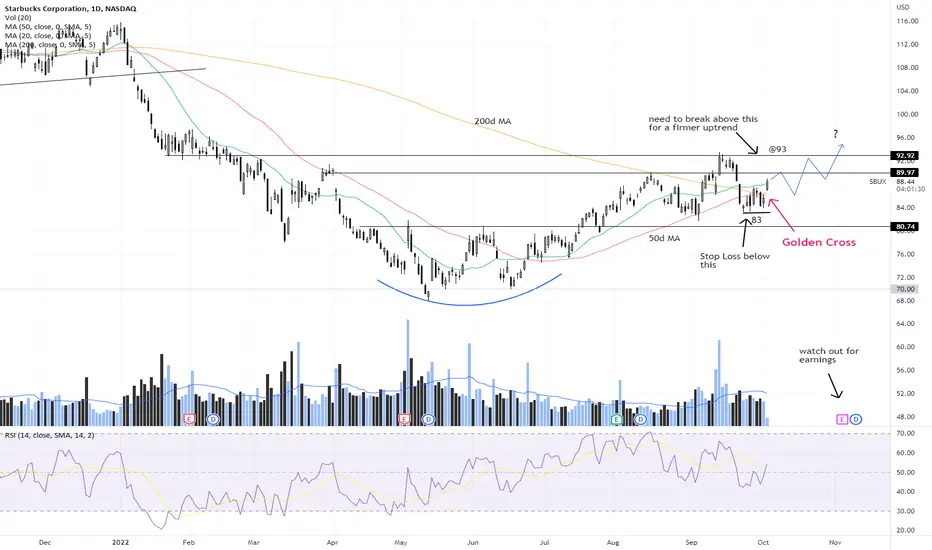
SBUX - Golden CrossSBUX just had a golden cross! (50day MA crossing above 200day MA). Could still be volatile as the 200day MA will take some time to flatten out and turn up. Stop loss should be about $1 below the recent pivot low of $83
Watch out for earnings nearer end of this month. Could be prudent to take some profits before earnings announcements.
Disclaimer: Just my 2 cents and not a trade advice. Kindly do your own due diligence and trade according to your own risk tolerance and don't forget that money management is important! Take care and Good Luck!
SBUX ShortHello,
SBUX I think it will start with E Wave targeting $75 and more to $55, Also there bearish flag pattern,

SBUXBearish RSI divergence into weekly supply zone & 200 sma. I can't be bullish if price is below $93.50. Looking for new 52 week lows if below the 0.618 retracement from the c0vid crash (~$83ish).

9/28/22 SBUXStarbucks Corporation ( NASDAQ:SBUX )
Sector: Consumer Services (Restaurants)
Market Capitalization: 96.703B
Current Price: $87.11
Breakout price: $90.30
Buy Zone (Top/Bottom Range): $86.30-$81.55
Price Target: $106.60-$108.40
Estimated Duration to Target: 65-71d
Contract of Interest: $SBUX 12/16/22 92.5c
Trade price as of publish date: $3.50/contract

#SBUX. Can I buy a coffee?A decisive breakdown gives me the confidence to ride this equity along with a hot coffee.

SBUX 6/7/2022SBUX
Starbucks will go down with its $4 cup of regular coffee.
After its Uptrend topped out April’21, SBUX entered a sideways market. This sideways market took form of a Head & Shoulders pattern.
Jan.’22, price broke down from this range. It confirmed the Head & Shoulder pattern as well as the Distribution stage. Price to enter a downtrend.
During the downtrend, price has been respecting the Dynamic Resistance of 50 ema. Anytime we have a downtrend, a pullback to the dynamic resistance, and have a Overbought Stochastic signal, this has been our entry to short.
March 30th,’22 was our 1st entry.
Currently, we have pulled back to dynamic resistance and have Overbought stochastic. Will be entering trade short
Entering trade short
Entry: 79.58
Stoploss: 84.22
Target: 62.26, 21.27%, 3.27 RR ratio

#stock #market #sbux #long The end of the negative trend?
The wedge shape seems to be broken, the movement of the indicators confirms the change. The exchange rate is looking for a direction.
The next 5 waves emerging?

Starbucks/USDPotential Diamond maturing on the the Monthly with Measured Price Actions options in the supposal future.

SBUX – Stage 2 Breakout AttemptSBUX is making the Stage 2 breakout attempt this week on approaching 2x the average weekly volume, with Relative Strength (RS) strongly outperforming the S&P 500 and the Stage Analysis Technical Attributes (SATA) indicator increasing to an 8 out of 10 on Wednesday on the breakout day. But it has fallen back to a SATA 8 today on the general market weakness, but price action is holding above the breakout with an inside day so far.
The indicators shown are three different style versions of the Stage Analysis Technical Attributes indicator, which is available to add in the community scripts.

SBUX: Have Bears Been Needing More Espressos?Primary Chart: Two Anchored VWAPS from Important Highs and Lows and Fibonacci Levels
Have bears been needing more espressos? Looking solely at SBUX's chart and ignoring most other equities and equity indices, one might suspect the indices had been doing well since May 12, 2022. SBUX put in a trading low on that date and has made higher lows ever since then.
Equity indices tell a much different story, however, with significant declines in mid-June 2022 that made lower lows in this bear market. Equity indices also experienced a significant decline in August and early September 2022.
Supplementary Chart A: Upper Bollinger Band Snap on SBUX's Daily Chart and SBUX's Relative Performance Compared to the S&P 500 AMEX:SPY
On Supplementary Chart A, notice the following technical features:
SBUX made a new multi-month high on September 14, 2022, whereas SP:SPX did not.
SBUX's low in May 2022 was not undercut by a June 2022 low, whereas SP:SPX 's low in May 2022 was in fact undercut by lower lows in June 2022.
SBUX has been making higher highs and higher lows since May 9, 2022, whereas SPX's price action has been more choppy. SPX made a lower low in June 2022 unlike SBUX. SPX made a lower high September 12, 2022, while SBUX did not. SPX did not snap its upper Bollinger Band today, September 14, 2022.
SBUX's 8-day EMA has held above its 21-day EMA for much of the time since the May 2022 low.
SBUX's decline in late August and early September 2022 occurred without breaking the structure of the intermediate-term uptrend that has been in existence since SBUX's May 2022 low.
Overall, SBUX has outperformed SPX substantially since SBUX's May 9, 2022, low. The outperformance of SBUX has been especially notable today, September 14, 2022. Ironically, this outperformance follows weeks of frustrating and choppy price action in the equity indices, as exemplified by the US index OANDA:SPX500USD . SPX rallied powerfully into August 16, 2022, then it fell sharply about -10% into early September 2022. This steep decline was followed by a 4-day rally of about +6%, which was followed by a 2-day decline of about -5%. So one might be forgiven for wondering whether traders and investors have needed more espressos, which of course could in theory cause a boost to demand for SBUX's beverages despite an ever inflating cost.
SBUX began struggling before the S&P 500 and the Nasdaq 100. Perhaps traders were enjoying their profits so much that they just started foregoing those pricey espressos more often. SPX made its all-time high on January 4, 2022. NDX made its all time high several weeks earlier. SBUX started struggling in July 2021, much earlier than broader markets did.
Supplementary Chart B: SBUX's Weakness Began Earlier than Broader Equity Indices
All humor aside, a longer-term view shows just how wide of a moat SBUX had built for itself worldwide regardless of where its beverages are deemed to rank amongst espresso makers. Consider SBUX's long-term logarithmic trendline shown in the chart below. Supplementary Chart C (below) shows how this line has been respected for decades. This longer logarithmic line goes back to 1992.
Supplementary Chart C.1: Long-Term Logarithmic Trendlines
Two more long-term trendlines are worth considering below. These are also drawn on Supplementary Chart C.2 (also logarithmic), and they are shorter in duration than the 1992-present trendline in Supplementary Chart C.1.
Supplementary Chart C.2: Two More Long-Term Logarithmic Trendlines
On Supplementary Chart C.2, notice that what appeared to be a decisive break in the longer-term logarithmic trendline in March 2022 was a failed breakdown, also known as a whipsaw. Price recovered back above the trendline as people realized the pandemic would not ultimately win in separating them from their beloved hand-crafted lattes.
But the longer logarithmic trendline was broken again this year in the broader bear market. Yet price recovered above this longer-term trendline this week. Was that due to all the market participants deciding it was more fun to have a drink with a friend at SBUX than to trade? Probably not, but it's an interesting coincidence that SBUX's outperformance starts to shine when equity indices have chopped and frustrated bears and bulls alike for the past several weeks and months.
The shorter logarithmic line (also a long-term line going back to March 2020) shown on Supplementary Chart C shows price holding above this line since the lows on May 2022.
What comes next? Equity indices have been in an ongoing bear market. The macroeconomic environment, hawkish central-bank policies, and tightening financial conditions would seem to suggest price cannot continue an unobstructed rise. But since May 2022, price has managed to carve out an intermediate-term uptrend structure in the midst of an ongoing bear market.
A significant anchored VWAP, shown in dark blue on the Primary Chart at the start of this article, lies directly overhead. This must be recovered along with the .50 (green) and .618 (gold) retracement levels at $97.35 and $104.19 before getting excessively optimistic.
But as everyone knows, a security's price can do anything it wants. And consumers can increase or decrease SBUX beverage consumption in the midst of a challenging financial environment where everything costs more, and less cash is available to pay for fancy drinks. But one might reasonably conclude that less consumption could be in store unless inflation can be brought down by hawkish central banks without causing a recession.
_____________________________________
Please note that this technical-analysis viewpoint could change at a moment's notice should price move beyond a level of invalidation. Further, proper risk-management techniques are vital to trading success.
Author's Comment: Thank you for reviewing this post and considering its charts and analysis. The author welcomes comments, discussion and debate (respectfully presented) in the comment section. Shared charts are especially helpful to support any opposing or alternative view. This article is intended to present an unbiased, technical view of the security or tradable risk asset discussed.
DISCLAIMER: This post contains commentary published solely for educational and informational purposes. This post's content (and any content available through links in this post) and its views do not constitute financial advice or an investment or trading recommendation, and they do not account for readers' personal financial circumstances, or their investing or trading objectives, time frame, and risk tolerance. Readers should perform their own due diligence, and consult a qualified financial adviser or other investment / financial professional before entering any trade, investment or other transaction.

the best example of how to identify a trend changeThis is the reason because the market is not going down, a symmetrical triangle marks the bottom of a trend.


PUTS on Starbucks $SBUX Target $85.50First lower high after a long bull channel also is testing the supply zone (order block)

Short scalp SBUXBased on its downtrend, regress off resistance and a familiar chart pattern confirmed by my technical indicators, I expect at least half a percent in profits IF
SBUX breaches Friday's low of $88.64 during Monday's session.

$SBUX Zig Zag Correction$SBUX Starbucks forming a zig zag correction.
Look for continued downside in the coming months.

sbux short below 81.50 lvlengulfing candle, head&shoulders, daily.
approaching past strong selling candles
in between ema 15 & 50ma
gucci bagger 🤑

SBUX - uptrend still intact (for now)Uptrend still intact unless we breach the near term support @ 84.
Bullish divergence is a harbinger that a near term bounce is in the works (note that any bounce from a bullish divergence is short term and may not translate into longer term trend).
Watch out for resistance at 90 as it may experience another consolidation around there.
A close above 90 will be a strong signal for the bulls.
Disclaimer: Just my 2 cents and not a trade advice. Kindly do your own due diligence and trade according to your own risk tolerance and don't forget that money management is important! Take care and Good Luck!

SBUXSBUX looks like great play for next week seems good resistance at 90-91 area zone. Manage your own R/R

Am I crazy? $SBUX SHORT 1HNot a financial advise.
$SBUX Seems to have reached the end of the rising wedge the rsi is losing momentum as well.
Let's see what happens now.

More room to goSBUX looks like it continue downward for at least a few more weeks. That is, until the fall white girls convention at your local Starbucks.

Rektuccino To Go.Bull trap is in motion - likely has more milk in it but don't hang around too long as the market is about to become lactose intolerant.

$SBUX with a Bullish outlook following its earnings #Stocks The PEAD projected a Bullish outlook for $SBUX after a Positive Under reaction following its earnings release placing the stock in drift A with an expected accuracy of 87.5%.
