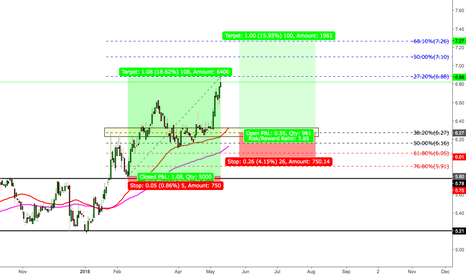
SIRI - Fibretrace at 0.618SIRI has acquired Pandora (P) and will likely increase subscriptions in coming quarters.
Earnings coming Oct. 26th
Dividend currently measly $0.01/Qtr or $0.04, or 0.64% with current price.
Unless market further corrects this should bounce to 0.500 fibretrace next week for 5% jump, ideally 382 for 10% target.
Placing low ball open order below this at $6.15.
SIRI1 trade ideas
SiriusXM, SIRI , Up TrendI am not licensed or certified by any individual or institution to give financial advice. I am not a professional Stock trader.
I believe SIRI is in an uptrend. I'm not going into a lot of detail with this one. I've drawn what I believe to be the Support and Resistance lines. SIRI may not bounce off Support, and that's ok as long as it keeps going up in price. Some trends (up or down) just hug one line or another and may not bounce between the two. Though a bounce would be nice, the overall trend is the important technical aspect to watch. If it bounces, great; if it just crawls along Support for the next week or two that's fine as well. With my lines drawn as they are you may notice the body of the candlestick from Friday, September 07, 2018 doesn't touch the line; but a low wick comes close. That low wick could be all the Stock needs for the price to start rising; but it also wouldn't surprise me if Monday's price action dropped to touch Support. Decide on your own strategy, and set an alert or automated Stop Loss for your safety net.
There are a couple different strategies to use with trends. You can buy at Support and sell at Resistance, and repeat until the pattern changes; or you can buy and hold. Either one will make money as long as the trend continues in the correct direction.
Let me know if you have any questions or comments.
Buy SIRI, Uptrend here.This stock is for long-term hold. Look at this nice trend, this is the gem in the market. Let's look at this closer. When I research the stock market I'm looking shares like this, I ask myself what the trend now, and what's the key data of this company.
The key data of this company you can read at SeekingAlpha, as for me I think the price will grow and grow because revenue and earnings growth, I will post the new review about SIRI a little late, I need time to research it closer.
the RSI indicator > 50, the MACD is trading above the centerline and EMA lines created two support for the price. 1+1 = slow uptrend.
If it's true "Berkshire Hathaway hold SIRI" then there's all the more reason to buy it.
ENTER : $5, 5.50, 6.50, 7
CLOSE: Long play
Next update soon. Likes/Comment. Yes, please :)
SIRI - SHORTWhat a run since the crash. Basically straight up for 10 years. SIRI is now hitting a former high ... I think it will find some rejection on the first attempt. RSI is cranked high on multiple time frames. Looking to dump soon. Market proxy stocks like AMZN NFLX APPL and FB plus the SPY will all influence.
SIRI break pattern breakout above 52w highs?SIRI has had some good times as of late and has built a nice bullish pole pattern with a nice upsloping 50 and 200 SMA. However, it has just rejected from it's (so far) 52w highs at 7.23 so I am cautious... I like to have a roof over my head you could say, with blue skies nobody really knows where the top could be!
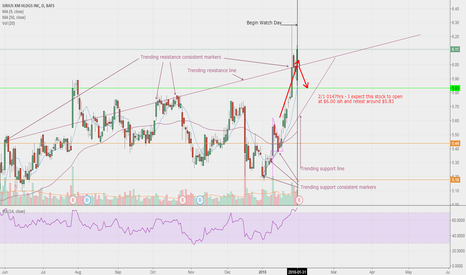
SIRI and a lesson in trend line chartingA nice flag setup 1/10 to 1/17 allowed this major bull move up and over the RSI Indicator past 70. Now it needs to retest and confirm its bull pricing. It may take several days to get to $5.83ish, as that is my solid support line in green. Alternatively, it may open sitting on top of trending resistance, thus making it a new support line and make another run. But i'm going with my original prediction lol
**Let's see what happens**
Drawing trending support and resistance lines allows you to really see where a stock is heading and what price points it wants to go. Add to that the RSI indicator (which tells you when the stock is overbought , or oversold ) and the volume chart and the picture gets clearer.
When drawing trending support and resistance lines, find commonality with several points (at least three) to draw from. If the points are drawn correctly, you will find more candlesticks near or touching your trend lines.
I am a new trader, i appreciate any feedback you have. Please help me if i need to update my thought process.
*Disclaimer- I am not a financial advisor. These are merely my opinions. Do your own research and formulate your own opinions regarding any moves you make. Seek professional assistance.
SIRIUS XM BULLISH FLAG/ FIBB RETRACEMENT THE FIRST GREEN CANDLE STICK BROKE OUT OF ITS RESISTANCE (SEE BULLISH FLAG). SEEMS TO ME THAT THIS STOCK MIGHT BE READY FOR ANOTHER RUN UP. THIS IDEA IS FURTHER BACKED BY THE FACT THAT THE GRAPH ALREADY BOUNCED OFF THE 50.0% FIBONACCI SUPPORT LEVEL AND IS HEADED TOWARDS MY TARGETED PROFIT AREAS OF 88.6%, 100.0%, AND 128.0%.
SIRI H&S PatternSiri has formed a head and shoulders pattern after a strong uptrend since it was $0.04 in February of 2009.
Some notes:
- Monthly indicators show the stock is well overbought and due for a pullback. Daily indicators show the stock is oversold after pulling back from $5.53 (52 week high). I would look for the stock to consolidate momentum near the neckline prior to pushing through.
- Monthly chart shows 2 fibonacci retracement points that the stock has used as support and resistance and could fall to should the stock break the H&S neckline. Moreover, on the daily chart, from $4.05 the right shoulder has used the 78.6% retrace as resistance, telling me that if the neckline breaks, our first point of resistance may be at $4.96 (61.8% retrace). (Yea, my brain hurts from all these fib numbers too)
- Volume is very telling here. Typically what you want to see in a H&S pattern is higher volume on the left shoulder, and possibly the head, with declining volume on the right shoulder's uptrend. Moreover, you'll notice that after the head formed (and frankly throughout the whole formation), negative days have shown higher volume than positive days.
- Monthly chart also shows a shooting star doji (without the shaved head). However, "technically", a shooting star doji should open lower, so don't read too much into that.
- On 3/22 the stock gapped lower and slowly covering the gap over the next few days before moving lower. No one likes a gap unfilled and this shows the stock is ready to move lower


