305 Resistance - 18Mar puts for swing tradeI am giving this trade more time than I usually do to avoid theta decay and to allow time for significant selling. If another market selloff starts soon, RSI will move back below 50 and I will see other indications to hold. I am using limited capital so I can hold for at least one week, even if price moves higher. Also I bought puts when stock was around 298, so I have to allow 305 to hold as resistance and still accept the loss if I have to exit.
SNOW trade ideas

SNOW is going downIt looks like we are finally rotating and by 28'th of JAN we made a low which violates mid-DEC low what indicates that money is flowing out from this stock. First nested cycle had it's low on 28'th of JAN what indicates that bigger cycle should be also negative and we should continue selloff till end of MARCH. 200$ is on the table, if market collapses 100+

Snowflake Analysis 10.02.2022Hello Traders,
welcome to this free and educational analysis.
I am going to explain where I think this asset is going to go over the next few days and weeks and where I would look for trading opportunities.
If you have any questions or suggestions which asset I should analyse tomorrow, please leave a comment below.
I will personally reply to every single comment!
If you enjoyed this analysis, I would definitely appreciate it, if you smash that like button and maybe consider following my channel.
Thank you for watching and I will see you tomorrow!

$SNOW - IHS? Seeing an IHS form. This is known to be a volatile stock but one that I continue to love.
I am holding my core and adding as the pattern confirms. Sell target is $380.

SNOWConfirmed a falling wedge reversal bullish pattern with a megaphone bottom. Expecting a move to the upside.

I THINK ITS THE TIME most of stocks depends on teslas trend . this one looks alright to me . just wait for a breakout and your back to moon . remember , keep leverage low. happy trading.

SNOW cup and handlePotential cup and handle on SNOW, has retraced to the golden pocket area. A break through this pocket would invalidate the trade and would create a PT of $185

SNOW: Short Swing TradeInverted hammer closing below the 200SMA. Bearish sign although weekly support could limit risk/reward.

SNOW: BOUNCE CANDIDATE?SNOW :
I put SNOW in the bounce candidate and potential continuation upward list. Why?
1. We retraced 50% of the move that started in May. This level is good to initiate a long trade because it allows you to place a stop loss not too far below the line.
2. Demark Sequential is on a 9 daily. (More details below on Demark indicators)
3. The chart looks like a big cup and handle and it seems that we are at the bottom of the handle. The top of the cup is 405. This one is very subjective though.
Depending on how markets open, I will look for a long entry . Swing trade .
My initial target will be 320-330, then I'll reassess. The success of the trade will depend on how Nasdaq behaves so I'll be careful and monitor the indexes closely.
If the trade fails, another interesting level will be around 268.
Note:
DeMark Indicators are designed to anticipate turning points in the market.
A Buy Setup occurs when there are 9 consecutive closes less than the close four days earlier.
Trade safe!


$SNOW, trading it 1/14For 1/14, intraday trading ideas for options; For red or green market day. #options #daytrading
Break over 301 (entry, long), it can see 309-314 (exit)
Break below 290 (entry, short), it can see 277-282 (exit)
Option Trading 101:
Risk what you can lose (0.5%-5%)
Watch buyers and sellers (their interactions & sentiment, ex. exhaustion of buying or selling, etc.) in strikes that you’re watching & the ticker too; this is how YOU manage YOUR trade.
Consider following and checking out bio and prior posts and recaps (on twitter ), have a great one. NOT FINANCIAL ADVICE.

US Stock In Play: $SNOW$SNOW setup for a mean reversion swing on its hammer candlestick pattern, sitting on its rising 200MA.
a reversal from this juncture would paint out a cup and handle pattern on its weekly
YoY
Q3 EPS +113%
Q3 Sales +110%

$SNOW, trading it 1/11For 1/11, intraday trading ideas for options; For red or green market day. #options #daytrading
Break over 308 (entry, long), it can see 316-319 (exit)
Break below 290 (entry, short), it can see 273-277 (exit)
Option Trading 101:
Risk what you can lose (0.5%-5%)
Watch buyers and sellers (their interactions & sentiment, ex. exhaustion of buying or selling, etc.) in strikes that you’re watching & the ticker too; this is how YOU manage YOUR trade.
Consider following and checking out bio and prior posts and recaps (on twitter ), have a great one. Not financial advice.

nice bounce off support zones! snow bouncing off its trend/strong support zones creating a little cluster support area.
We will most likely see a little bounce to 324.79 before the next pullback.
like and follow for more

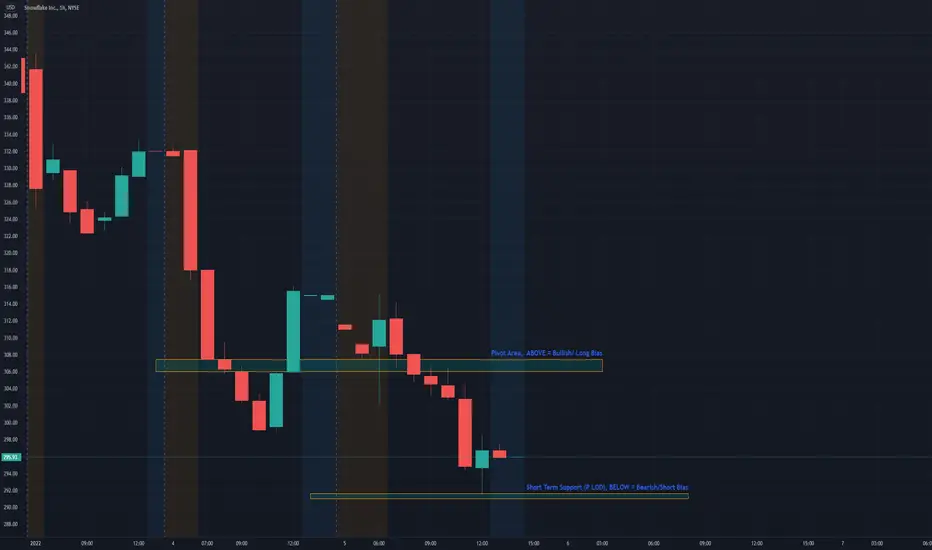
$SNOW, trading it 1/10For 1/10, intraday trading ideas for options; For red or green market day. #options #daytrading
Break over 308 (entry, long), it can see 319-324 (exit)
Break below 292 (entry, short), it can see 276-281 (exit), WATCH that ~285 area
Option Trading 101:
Risk what you can lose (0.5%-5%)
Watch buyers and sellers (their interactions & sentiment, ex. exhaustion of buying or selling, etc.) in strikes that you’re watching & the ticker too; this is how YOU manage YOUR trade.
Consider following and checking out bio and prior posts and recaps (on twitter), have a great one. Not financial advice.

SNOW held 200 MASNOW showed a bullish reaction to the 200 MA & respected the descending channel as support. Entering calls here, expecting $315-$320 range next week.

Snow - is overI will look for snow later if I wanted to own this garbage in a long position (FYI, I never intend to own SNOW stock)

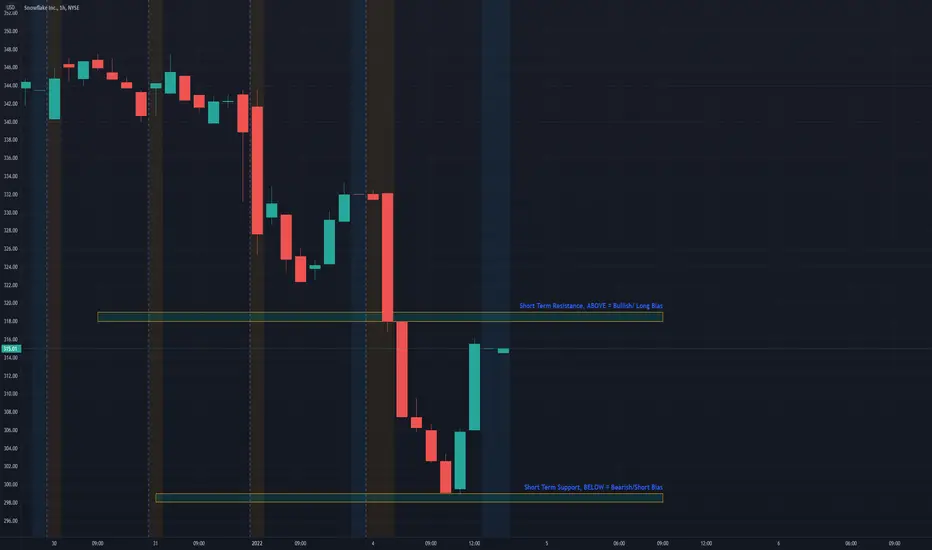
$SNOW, trading it 1/7For 1/7, intraday trading ideas for options; For red or green market day. #options #daytrading
Break over 307 (entry, long), it can see 319-324 (exit)
Break below 291 (entry, short), it can see 274-279 (exit), WATCH THAT 286 area (Previous Day Low)
Option Trading 101:
Risk what you can lose (0.5%-5%)
Watch buyers and sellers (their interactions & sentiment, ex. exhaustion of buying or selling, etc.) in strikes that you’re watching & the ticker too; this is how YOU manage YOUR trade.
Consider following and checking out my prior posts & recaps (on twitter), have a great one. Not financial advice.

$SNOW, trading it 1/6For 1/6, intraday trading ideas for options; For red or green market day. #options #daytrading
Break over 307.5 (entry, long), it can see 317.5-323.5 (exit)
Break below 291 (entry, short), it can see 275-280 (exit)
Option Trading 101:
Risk what you can lose (0.5%-5%)
Watch buyers and sellers (their interactions & sentiment, ex. exhaustion of buying or selling, etc.) in strikes that you’re watching & the ticker too; this is how YOU manage YOUR trade.
Consider following and checking out my prior posts & recaps (on twitter), have a great one. Not financial advice.

$SNOW, trading it 1/5For 1/5, intraday trading ideas for options; For red or green market day. #options #daytrading
Break over 319 (entry, long), it can see 330-335 (exit)
Break below 298 (entry, short), it can see 282-287 (exit)
Option Trading 101:
Risk what you can lose (0.5%-5%)
Watch buyers and sellers (their interactions & sentiment, ex. exhaustion of buying or selling, etc.) in strikes that you’re watching & the ticker too; this is how YOU manage YOUR trade.
Consider following and checking out my prior posts, have a great one. Not financial advice.
$SNOW, trading it 1/4For 1/4, intraday trading ideas for options trading; For red or green market day.
Break over 335 (entry, long), it can see 345-350 (exit)
Break below 322 (entry, short), it can see 307-312 (exit)
#options #daytrading
Option Trading 101:
Risk what you can lose (0.5%-5%)
Watch buyers and sellers (their interactions & sentiment, ex. exhaustion of buying or selling, etc.) in strikes that you’re watching & the ticker too; this is how YOU manage YOUR trade.
Consider following and checking out my prior posts, have a great one. Not financial advice.

SNOWFLAKE INCA wonderful break of the support that held the bullish trend. since May . Right now. there is a big probability that the market goes towards the level of 275 again. which will be a support. and if ever he break it down there is a probability that we will see it towards the level of 210
