SPY/QQQ Plan Your Trade Video for 6-24 : Flat-Down patternToday's pattern suggests the SPY/QQQ will move in a consolidated downward type of price trend.
Given the news that a ceasefire was initiated yesterday - and ENDED yesterday with Iran/Israel trading missile attacks and other conflicts, suggests the markets may react to extended FEAR today.
Gold and Silver are both moving downward. I see this as a PANIC move in metals.
When metals move into a Panic Selling phase, usually the SPY/QQQ also move into a panic selling phase.
Bitcoin bounced back above $105k. Could be very interesting to see how all these moves play out over the rest of this week.
Buckle up. Volatility is BACK.
Get some.
#trading #research #investing #tradingalgos #tradingsignals #cycles #fibonacci #elliotwave #modelingsystems #stocks #bitcoin #btcusd #cryptos #spy #gold #nq #investing #trading #spytrading #spymarket #tradingmarket #stockmarket #silver
SPY trade ideas

June 27th, 2025 - Morning BriefFriday, June 27, 2025. Markets are on the edge, and if you thought summer would bring calm, think again. Today’s script is pure adrenaline.
Overnight, the U.S. and China finally inked a trade deal that actually matters: tariffs are coming down, and rare earths are flowing again. Tech and manufacturing stocks are already celebrating, with SP:SPX and CME_MINI:NQ1! futures inching toward fresh record highs. NASDAQ:NVDA is still the market’s favorite lottery ticket, hitting another all-time high. Meanwhile, NYSE:NKE just spiked 10% premarket after beating earnings. Never mind the $1 billion tariff punch, they’ll “manage it.” Sure.
But the real show is the May PCE inflation data dropping this morning. The Fed’s favorite gauge is expected to tick up to 2.3% year-over-year, with core PCE at 2.6%. If the numbers surprise, brace for whiplash in rates and risk assets. GDP’s third estimate confirmed a -0.5% contraction in Q1, so the “soft landing” crowd is sweating. Jobless claims and new home sales hit at 10:00 AM ET. Expect every algo on the Street to be watching.
Trump is making noise about firing Powell before 2026, which has traders betting on earlier rate cuts. If you’re looking for stability, you’re in the wrong casino.
Here’s where things stand:
- OANDA:XAUUSD : $3,280–$3,334/oz (slipping as risk appetite returns)
- BLACKBULL:WTI : $65.64–$65.82/barrel (steady, but one headline away from chaos)
- BINANCE:BTCUSDT : $107,215–$107,477 (down, but still a six-figure fever dream)
- CME_MINI:ES1! : Hovering just below the 6,144 record
Today’s takeaway: The market’s running on hope, caffeine, and denial. Stay sharp, one bad print and the rally could turn into a stampede for the exits. Welcome to the volatility vortex.
Been building something for US swing traders — if you’re one, I’d really appreciate your feedback. Free to test, link in Bio

SPY Rejected at Gamma Wall–Watch $610 Breakdown or $615 Reclaim🧠 GEX-Based Options Sentiment:
SPY closed Friday with a rejection off the Highest Positive Net GEX / Gamma Wall at $615, with sellers defending the upper structure near the 2nd Call Wall at $620.
Support now lies in the $608–$604 range, with $605.54 and $604.45 aligning with GEX magnets and prior structure. Below that, there’s a gap to the HVL zone near $599, and the gamma floor starts deep around $591, which is also defended by the 2nd and 3rd PUT Walls.
Implied Volatility Rank is 12.2, with IVX below average. This implies premium selling could be dominant unless we break key levels. Meanwhile, PUT flow dominates at 31.9%, showing a clear defensive posture by institutions.
🔧 Options Trade Setup (for Monday–Wednesday):
Bearish Setup:
If SPY confirms under $610, especially during the first hour Monday, it could trigger a fade toward $605 or even $599 HVL.
Consider a PUT debit spread like 610p/600p (Jul 3).
Stop out if price reclaims $613.50–$615 cleanly.
Bullish Setup:
If SPY holds $610 and reclaims $615 with force, it can squeeze into the GEX void toward $620–$622.
Consider a CALL debit spread like 615c/620c (Jul 3).
Stop if price breaks back under $610 with volume.
📉 Intraday Technical Breakdown (1H Chart):
We now have back-to-back CHoCHs printed below rising wedge structure, followed by a failed retest at the top. This is a textbook sign of exhaustion. The final BOS and CHoCH from Friday confirmed that buyers lost short-term control.
The current structure is rolling over with lower highs, and SPY is now trading inside a descending micro-channel after rejection at $615.
Volume picked up on the Thursday/Friday rejection, which adds weight to the downside scenario unless we open strong Monday.
📌 Key Levels to Watch:
$617.00 – Upper Gamma ceiling
$615.00 – Gamma Wall & recent supply zone
$613.50 – Mid-level rejection pivot
$610.00 – Structure support now under threat
$608.48 – Intraday gamma magnet
$605.54 / $604.45 – Strong confluence support zone
$599.49 – HVL target zone
$591.90 – Gamma floor if broader selloff triggers
✅ Thoughts and Monday Game Plan:
SPY looks vulnerable under $610 — this is the most important level to watch. If that breaks and holds below in the first 30–60 minutes, we likely fade to $605 or lower.
The ideal trade setup would be to short the retest of $610 from below, or buy PUTs on confirmed weakness into the gamma air pocket. Alternatively, wait for a high-volume reclaim of $615 to trade with the bulls, but until then, the path of least resistance is down.
Macro catalysts are light, but pre-holiday positioning could bring volatility — stay nimble.
Disclaimer:
This analysis is for educational purposes only and not financial advice. Always use proper risk management and trade with a plan.

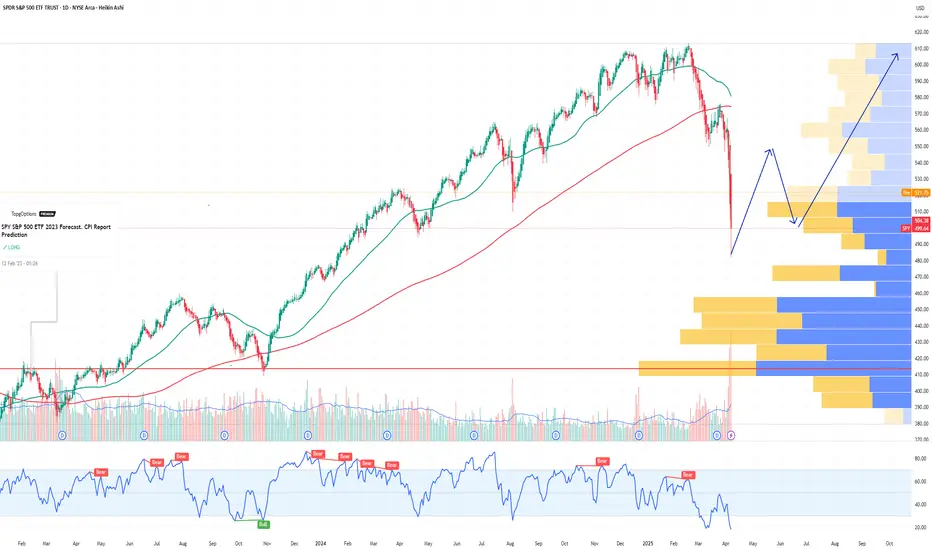
SPY S&P 500 ETF Potential W-Shaped Recovery Forming We may be witnessing the formation of a W-shaped recovery on the SPY (S&P 500 ETF) – a classic double-bottom structure that often signals a strong reversal after a period of correction or volatility. Let’s dive into the technicals and what this could mean in the sessions ahead.
🔍 The Technical Setup:
SPY recently tested key support around the $485-$500 zone, bouncing off that area twice in the past few weeks. This gives us the left leg of the W and the first bottom. After a modest relief rally to ~$520, we saw another pullback – but this second dip failed to break below the first bottom, a hallmark of the W-pattern.
As of today, SPY is starting to reclaim ground toward the $517-$520 resistance zone. If bulls can push through this neckline area, especially with volume confirmation, we could see a breakout that targets the $530-$535 area in the short term.
🔑 Key Levels to Watch:
Support: $490-$500 (double-bottom support zone)
Neckline/Resistance: $530
Breakout Target: $550 (previous highs)
Invalidation: A break below $490 with volume could invalidate the W-recovery idea and shift bias bearish.
📊 Momentum & Volume:
RSI is climbing back above the 50 level – bullish momentum building.
MACD shows a potential crossover forming, hinting at a shift in trend.
Watch for increasing buy volume as SPY approaches the neckline – that’s where the bulls will need to step up.
🧠 Macro & Earnings Angle:
Don’t forget – we’re entering a heavy earnings season and rate cut expectations are still a wildcard. A dovish tone from the Fed and strong corporate results could be the fuel that sends SPY higher to complete this W-shaped recovery.
🧭 Final Thoughts:
This is a high-probability setup if neckline resistance is broken cleanly. Wait for confirmation before going heavy – fakeouts are common in double-bottom scenarios. If we do get the breakout, we may be looking at a broader market rebound going into summer.
🔔 Set alerts near $525. A confirmed breakout could mean the bulls are back in charge.
SPY ATH TARGET 650Trend: Strong bullish continuation. Price just broke above the key 610 level, entering a momentum phase toward the projected 650 target.
Structure: SPY is trading inside a rising channel. The upper bound aligns with the 650 level, suggesting this is the next liquidity zone.
Support Zones:
610: Now a critical support. If it holds, buyers remain in control.
580–560: First unfilled gap — a likely magnet if price dips.
540–530: Second unfilled gap — stronger support on deeper pullback.
500–480: Major demand block — structural bottom of the current rally.
Moving Average (EMA): Price is trading above its EMA, confirming bullish momentum.
Gaps: Two visible gaps remain open below, both likely to act as magnets if bulls lose momentum.
📈 Expected Range:
Above 610 → Target: 650
Below 610 → Watch for gap fills at 580 and 540

SP500 possible Turn Just a possibility - DJT and IWM have turned down, they often lead the moves. Gold at support and holding. Oil support is holding. Natural gas probably bounces here. BTC at channel resistance

SPY . Market Corrections IncomingHey Guys it's been a long time but I'm going to be more consistent in publishing more. The S&P 500 has hit a level of resistance 4 times on the daily chart. which is very very telling. Yes I understand we have news and war being a major catalyst in the stock market rallying a lot lately but this is only temporary. This previous witching was last Friday if you weren't aware which also caused the small pull back. So for further bullishness to continue let's look at the earnings for the magnificent 7 and the rest of the tech sector. More war means more money for the market . we have the next witching in September . and so here are my projections. We take a step higher in July as we go into the peak of SOLAR Maximum . please do your research. and then after that by September we go into pull season . Happy trading

update on the Markets 6-26SPY may reverse today, I'm watching IWM for clues. Gold losing support as of now. Oil may come down more and then bounce again. NG is hard to read. BTC still holding below it's channel.

What Is The Market Waiting For?Good Morning Trading Fam,
Our stock and crypto markets seem to have stalled. You may be wondering what they are waiting for. Quite simply, the S&P 500 has reached a double-top. That's all. There may be some more pause here for the next week or so. Barring any significant bearish geopolitical or other events, I expect us to move higher. Any FUD at all will send the market back down again. So yes, unfortunately, the next move(s) will be mostly predicated on news. Traders are rather fragile rn. Trade accordingly.
Best,
Stew

SPY GEX & Technical Setup – Aiming for Gamma Lift-Off?GEX Outlook (June 24, 2025):
SPY is sitting right on top of a major Gamma Wall at 607–610, with high net positive GEX and strong Call Wall stacking above. The 2nd Call Wall (609) and GEX10 (611) suggest bullish optionality remains intact if SPY can hold above 605.
* GEX Sentiment: 🟢🟢🟢🟢
* IVR: 13.7 (low implied volatility rank, bullish)
* IVx Avg: 16.7
* Put Walls: Strong support at 595 and 591
* Call Pressure: Builds up from 605 to 611
📌 This is a prime environment for long CALLs, especially for traders expecting momentum continuation through 607+.
Price Action (1H): Smart Money Concepts Perspective
* Break of Structure (BOS) confirmed at ~606
* Retest held strong near 600.15–604.45, validating support
* Clear bullish CHoCH and BOS sequence with strong volume
* Current candle consolidation inside a small supply zone near 607 (possible pause before continuation)
Support Zones:
* 604.45: First line of defense
* 600.15: Breaker block retest
* 591.90: Ultimate bear invalidation zone
Resistance Targets:
* 610: Next major target (2nd Call Wall)
* 611+: GEX10/extension zone for squeeze
🔍 Trade Idea (Scalp or Swing)
Bullish Scenario (CALLs setup):
* Entry: On retest of 604.5–605 zone
* Target: 610–611 (Gamma zone breakout)
* Stop: Below 600.15
* Options Play: Buy 610C 0DTE/1DTE if intraday bounce confirmed above 605 or breakout continuation above 607
Bearish Reversal?
* Only if SPY breaks below 600 with momentum + volume. Otherwise, dip = opportunity.
Summary:
SPY is riding a strong bullish structure with GEX favoring upward pressure. As long as 604–605 holds, dips are for buying. Watch 607–610 for breakout confirmation. Options market flow supports further upside if volatility remains controlled.
Disclaimer: This analysis is for educational purposes only and not financial advice. Always do your own due diligence before trading.

SPY/QQQ Plan Your Trade for 6-25 : Breakaway PatternToday's Breakaway pattern suggests the SPY/QQQ may attempt to move into another breakaway price move - very similar to yesterday's price move.
I will add that I believe the SPY cycle patterns have already moved through a breakaway phase with the ceasefire news early this week. I believe the gap and breakaway move yesterday may be the breakaway trend we are expecting today.
That would suggest the markets could pause and pullback a bit over the next few days.
Gold and Silver are trying to find a bottom after the brief selling that took place over the past few days. I really do believe Gold and Silver are poised to make a big move higher.
Bitcoin is on a terror to the upside. But be cautious of the downward cycle channel that may prompt a rollover in BTCUSD near the $107,500 level.
I spend a little time near the end of this video highlighting my work on the Tesla 3-6-9 price theory and going over a few examples for my new book on trading.
Enjoy the quick look at some of the more advanced techniques I'm working to unlock for all of you.
Get some.
#trading #research #investing #tradingalgos #tradingsignals #cycles #fibonacci #elliotwave #modelingsystems #stocks #bitcoin #btcusd #cryptos #spy #gold #nq #investing #trading #spytrading #spymarket #tradingmarket #stockmarket #silver

SPY/QQQ Plan Your Trade For 6-23 : CRUSH PatternToday's CRUSH pattern suggests the markets will struggle to find any support for a rally. A CRUSH pattern is usually a large breakdown type of price bar that moves aggressively against the dominant trend.
Som, today I'm expecting some fairly large price action and I believe the markets may start a breakdown move this week as we continue to get more news related to the Israel/Iran/US conflict.
This week will be a "resettling" week in my opinion. Buyers will start to actively liquidate and reposition assets as we move deeper into this conflict. When buyers turn into sellers (to get out), the markets usually react very aggressively in trend.
Metals continue to hold up without making any big moves. I believe the increased FEAR level could play out as a moderate rally for metals over the next 15-30+ days.
BTCUSD broke down very hard (more than 6%) over the past 3-4+ days. This is a big move downward for Bitcoin and could suggest US technology stocks/sectors could also collapse on fear of a "rollover top" in the US stock market.
Smart traders will hedge and pull capital away from this potential top - just like I've been suggesting for the past 2-3+ weeks.
Oddly enough, if we do get a rollover/top this week because of the Iran conflict, it plays right into my Excess Phase Peak pattern and the predictions I've been making over the past 4+ months.
No, I don't foresee events like this Israel/US/Iran conflict. I can't see into the future.
What I can do, and continue to try to deliver, is the best analysis I can offer without becoming BIASED by indicators, comments, or other inputs.
I just read the chart and will tell you what I see as the most likely outcome.
Get some..
#trading #research #investing #tradingalgos #tradingsignals #cycles #fibonacci #elliotwave #modelingsystems #stocks #bitcoin #btcusd #cryptos #spy #gold #nq #investing #trading #spytrading #spymarket #tradingmarket #stockmarket #silver

Monday UpdateSPX and SPY both look like they are trying to decide if the 18ma will hold as support or not, we have to wait for the close. Gold looks like it wants to go higher. Oil and Natural Gas as well. I forgot BTC, I'll do it tomorrow.

Update into the closeSPY is at resistance. OIL looks like a C wave. My feeling is there could be a swift down move on SPX futures overnight. I'm wrong if we open above 602 on SPY tomorrow


SPY Breaks Out of Gamma Box! Will It a Trend Day or Fade Setup?SPY Breaks Out of Gamma Box! Will IT Trigger a Trend Day or Fade Setup? 🚀📉
🔍 Chart Overview
* Timeframes: 1H (GEX + key zones), 15M (Price action + SMC).
* Price: $601.65 at close.
* SPY broke above 600, a key GEX resistance and call wall area, and is pushing into a zone with less options resistance.
📊 GEX + Options Sentiment
* 601–602 Zone: Highest positive NET GEX, aligned with CALL wall and resistance—where market makers may start to hedge against upside.
* 604–606: Next upside liquidity zone; low GEX, meaning little dealer resistance = gamma vacuum potential.
* IVR: 21.2 (elevated slightly).
* Put Positioning: 78.2% heavy skew—market still defensively positioned.
* GEX Shift: Bullish; breakout above 599–600 flips structure toward 604 as target.
📐 Smart Money Concepts (15M Chart)
* CHoCH → BOS Confirmed: Trend structure flipped bullish today.
* SPY rallied off demand at 591.90 (old support/OB) with increasing volume.
* Currently tapping into minor supply zone (purple box) at 601.5–602.
📈 Key Technical Levels
* Support:
* 599.00 (GEX flip zone)
* 596.41 (FVG support)
* 594.28 (OB + FVG confluence)
* Resistance:
* 602.00 (GEX wall + supply)
* 604.85 (GEX extension zone)
📌 Scenarios
🟢 Bullish Play (Momentum Breakout)
* Entry: Above 602.20 (confirm breakout of supply)
* Targets: 604.50 → 606.00
* Stop: Below 600.40
* Confluence: Gamma vacuum + weak resistance = ideal for calls if IV remains controlled.
🔴 Bearish Play (Fade from GEX Wall)
* Entry: Rejects 602 with wicks + high volume reversal
* Targets: 599.50 → 597.00 → 594.50
* Stop: Above 602.50
* Confluence: Heavy puts suggest rally could be faded unless institutions step in.
💡 Game Plan
* Watch 602 rejection or acceptance—this will likely decide the rest of the week's direction.
* If accepted, it's likely a gamma squeeze to 604–606.
* If rejected, SPY may dip back to 599–597 to retest bullish structure.
🎯 Options Strategy
* Bullish: Weekly 602C or 604C if breakout confirmed.
* Bearish: 600P for fade/rejection plays. Higher risk due to squeeze potential—tight stops.
🧠 Final Thoughts
SPY is at a pivotal level. The breakout from 599 suggests bulls in control, but we're now at Gamma resistance. Keep tight risk if playing calls above 602. The upside is open—but only if dealers lose control.
Disclaimer: This analysis is for educational purposes only and does not constitute financial advice. Always do your own research and manage your risk before trading.

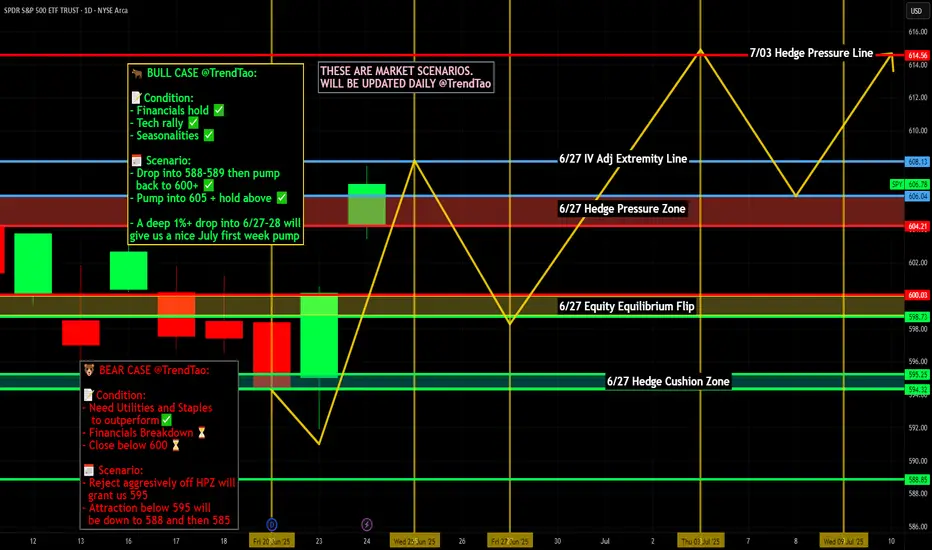
Nightly $SPY / $SPX Scenarios for June 25, 2025🔮 Nightly AMEX:SPY / SP:SPX Scenarios for June 25, 2025 🔮
🌍 Market-Moving News 🌍
💱 Dollar Slides on Middle East Ceasefire Optimism
A fragile ceasefire between Israel and Iran lifted risk sentiment across global markets. The U.S. dollar weakened, while the euro and British pound hovered near multi‑year highs
📈 Equities Near Record Highs
The S&P 500 and Nasdaq pushed toward all-time highs on June 25, supported by the Middle East truce and retreating energy prices. The S&P 500 rallied ~1.1%, with tech and discretionary sectors leading the charge
🛢 Oil & Treasuries Dip, Yield Cuts Anticipated
Oil plunged ~6% to ~$65/bbl as conflict fears eased. Softer prices plus weak consumer confidence spurred expectations of up to 60 bps in Fed rate cuts by December; Treasury yields pulled back accordingly
📉 Consumer Confidence Falls Again
The Conference Board’s index dropped to 93—the lowest level since May 2020—as concerns over tariffs and job availability weighed on households
📊 Key Data Releases 📊
📅 Wednesday, June 25:
(No major U.S. economic data scheduled)
Markets remain focused on geopolitical dynamics, Fed commentary, and next week’s PCE inflation release.
⚠️ Disclaimer:
This information is for educational and informational purposes only and should not be construed as financial advice. Always consult a licensed financial advisor before making investment decisions.
📌 #trading #stockmarket #economy #geopolitics #Fed #inflation #technicalanalysis
SPY (S&P500 ETF) - Price Bouncing Up from Support after NewsSPY (S&P500 ETF) price has bounced up from the $593 support level after recent global news (de-escalation news).
Price action has slowed and consolidated in June 2025, and the S&P500 is still maintaining a price uptrend.
The 50EMA and 20EMA Golden Cross is still active and in progress (since May 2025).
The next stock market earnings season is not for another 3 months. Inflation, interest rate news, global events, government news, corporate news will continue to affect price volatility this summer.
Resistance Levels: $604, $610, $612, $619.
Support Levels: $600, $593, $586, $579.

6/24/25 - $SPY - punchbowl musings. moar upside into YE.6/24/25 :: VROCKSTAR :: pondering $SPY/M2
I'll attempt to keep this punchy.
- Moar upside into YE, but with a few bumps along the road. We're probably due for a small garden variety pullback sooner vs. later. And it should be bought, without flinching. Index options are easiest and lowest risk way to play this trend, unless u like single names like me :)
- I look at the above chart SPY/M2 (so S&P divided by M2) a lot
- The last time it grabbed my interest was earlier this yr before the market did it's lil dip, now it's grabbing my interest again since we've played out a bottom and a recovery
- I wonder... is px action going to follow '98 (door 1) or the trapdoors of '08/09 (door 2)/ '20 (door 3)/ '22 (door 4).
- I suspect it's closer to '98 (and btw had this thesis before seeing the recovery in the last two months, so it's played out)
- While any event can cause the market to reset another 20-30% from here, the problem is "we don't have this event". Clearly war (at least an escalating one, not a multi-week headline-driven one - sad as any war is) won't do it. Also the Fed is just about telling Trump to suck the long one... and even that rates might go higher, but the mkt also is either ignoring this/ or frankly- might acknowledge it and doesn't care. Also we have a consumer recession on the horizon - this is no surprise to many of us. Market still doesn't really care. So what kind of event is it?
- Well in door 2 we had a pretty gnarly set of defaults in US housing. Will this happen again? Probably not in housing, there will be pockets, yes. But these sorts of things typically don't repeat, esp with the money printer locked and loaded.
- Door 3 was a "pandemic" (quotes intended) which freaked everyone out. Well played Klaus. But doubtful that card can be re-played without also seeing the money bazooka locked and loaded.
- Door 4 was rates FINALLY seeing liftoff after over a decade. But now they're pretty restrictive. Can they get more restrictive? Sure. But will they go up another 2...3...4...%? Unlikely. Direction ultimately is probably lower *eventually*, even if there's a bit more economic pain on mainstreet.
- So door 1 is somewhat unique. The market doesn't remember that timeframe well. And it feels like tech is back in that sweetspot. Mag 7 (just use QQQ on it's IWM- small cap pair) so QQQ/IWM or even SPY/IWM (both contain similar mag 7 weightings) shows no brakes. Hard to see why I'd rather pay 15 or 20x for a small cap with mid singles growth and no margin or moat vs. say NVDA at a slight premium. You get the point. So I think we're back there.
- Does that mean we get a garden variety pullbacks here/there along the way as headlines hit? Probably. I see a lot of crazy 0dte'ing all over the place. The cheapest and probably most profitable way to play that would simply be sticking to index options, tbh. But alas, that's not a 10 or 20x ;)
- Could a consumer recession in 2H keep stonks flat or only +5-10% higher capped until we can see "beyond"? Maybe. But remember, the big leaders (most Mag 7) are B2B and AI-driven. So you can paint an earnings story (lower costs b/c of tech) even if the top-lines are challenged. Again, let's see.
- Alas people have been DM'ing me "WHY ARE YOU SHORT?"
- Simply put, I have conviction in a very few number of things right now on the long side. I do think the market will tend to see higher highs, and there's not an obvious reason why that ends, just yet. And the market needs a reason to go down, not up.
- However, a lot of ETFs I've found to short are offering me ATM exposure for 5-10x leverage for very very little premium (low IV) relative to picking and banging my head causing brain damage to keep identifying the single names. Most of these ETFs own "the same company" which all trade correlation 1... so in any garden variety pullback, they will all trade v similarly and so I'd rather just pay less for the hedge.
- Therefore I remain with high BTC exposure (vis a vis OTC:OBTC ) at nearly 50% of my book. I think this converts to ETF in the next 90 days, giving me another 10-12% pop (as it's 88-90% discount to spot). Therefore, I can pack just a 1.4% IBIT ATM short (vis a vis puts) for nearly half this exposure. If BTC runs, as I expect, but can't predict exactly (EVEN IF THE CONVERT DOESN'T HAPPEN), I lose the 1.4% but probably pick up a solid 10...15...20% on this OBTC exposure. Seems like a good hedge.
- Same thing for BUG, ROBT, UFO... IV is just low. These are all correlation 1 baskets. They let me offset my NXT and GAMB size. That's all. I'm not calling "SHORT IT ALL" but rather, if things keep running "yes" i'll make less... but I believe my long exposure OBTC/ NXT and GAMB will outrun these ETFs. And even if they are similar in px action... I'll just make less, but it will still be positive.
- Now if the market really does puke 10-15 or 20%... I'll take these shorts and just deploy across all the work on single names I like. V likely the usual suspects are the one's I've written about and I'd size these up. King among them will be BTC.
Hope that helps. I like looking at this chart. Perhaps you have one that catches your attention too... that allows us a glimpse around what inning we're in.
The TL;DR is I think we're in inning 7 of this multi-decade run. I'd guess a true top gets put in in the coming years. But unlikely this year. And I'd be surprised if we retest the Mar/ Apr lows. Dips of the 5-10% size should be bought aggressively, not feared.
Alas who knows. I don't have a crystal ball.
V

Market has decidedI mentioned yesterday I thought it would be either a large break up or large breakdown, it was a large break up after all. All time highs are very close, so probably this week we will get there, unless something happens overnight or tomorrow. Gold looks bearish but is holding support as of now. Oil is at support. Nat Gas lost support. BTC is in a channel and looks more bullish now that it's over 105k.

SPY 15-Min — Weak-High Sweep in Play• Discount BOS at 603.95 → impulsive leg to 606.7 (0.886)
• Weak high tagged at 607.16 – expecting continuation to 1.382 ≈ 608.61 then 1.854 ≈ 610.92
• Invalidation if price closes below 605.45 session VWAP band
• Targets: 608.61 → 610.92
• Risk: stop 604.9 (below 0.5 Fib)
VolanX bias remains risk-on while micro structure stair-steps above the 9-EMA channel.
Educational only – not financial advice
#SPY #SMP500 #OrderFlow #Fib #VolanX #WaverVanir

Nightly $SPY / $SPX Scenarios for June 24, 2025🔮 Nightly AMEX:SPY / SP:SPX Scenarios for June 24, 2025 🔮
🌍 Market-Moving News 🌍
🇺🇸 Markets Eye Powell Testimony & Consumer Confidence
Today brings a double dose of market-moving data: the June Consumer Confidence Index and Fed Chair Jerome Powell’s testimony before Congress. These will be key indicators of household sentiment and potential shifts in Fed rate guidance
🛢️ Oil Volatility Persists on Middle East Strain
Oil prices briefly spiked after U.S. strikes on Iran’s nuclear facilities, prompting fears of supply disruptions. However, prices have since dipped as ceasefire hopes emerge. Investors remain cautious on energy headwinds
💱 Dollar Retraces on Safe-Haven Rotation
The dollar softened after peaking as geopolitical tensions eased slightly. Still, it remains sensitive to Powell’s tone and confidence data, which could reintroduce volatility
📊 Key Data Releases & Events 📊
📅 Tuesday, June 24:
10:00 AM ET – Conference Board Consumer Confidence (June)
Monitors household optimism; a rebound could support consumer spending and equities.
10:00 AM ET – Fed Chair Powell Testimony Begins
Powell appears before the House Financial Services Committee. Market focus: inflation outlook, tariffs, and potential timing for rate cuts.
⚠️ Disclaimer:
This information is for educational and informational purposes only and should not be construed as financial advice. Always consult a licensed financial advisor before making investment decisions.
📌 #trading #stockmarket #economy #Fed #trade #energy #technicalanalysis

SPY/QQQ Plan Your Trade For 6-23 : Afternoon UpdateWhat happened to the CRUSH pattern?
Everyone wants to know why the CRUSH pattern didn't show up today. Well, I keep telling all of you these SPY Cycle Patterns are based on GANN, Tesla and Fibonacci price structures. They do not take into consideration news, global events, or anything outside of PRICE.
They are predictive - meaning they attempt to predict potential price shapes/patterns weeks, months, and years in advance.
The markets, obviously, are seeking some normalcy after the Iran conflict. I thought the CRUSH pattern would have been a perfect fit for today - but obviously the markets didn't agree.
If you have been following my videos, you know I keep saying the US stock market is acting as a global hedge for risks. Traders are pouring capital into the US stock market as a way to avoid global risk factors.
Traders are also pouring capital into Gold/Silver. Demand for physical metals is through the roof right now.
Time will tell if my Excess Phase Peak pattern plays out as I expect or if we rally to new ATHs.
Obviously, this sideways rollover topping pattern could present a breakaway in either direction.
Again, my patterns are not correlated based on news or other events. They are strictly price-based.
Get some...
#trading #research #investing #tradingalgos #tradingsignals #cycles #fibonacci #elliotwave #modelingsystems #stocks #bitcoin #btcusd #cryptos #spy #gold #nq #investing #trading #spytrading #spymarket #tradingmarket #stockmarket #silver
