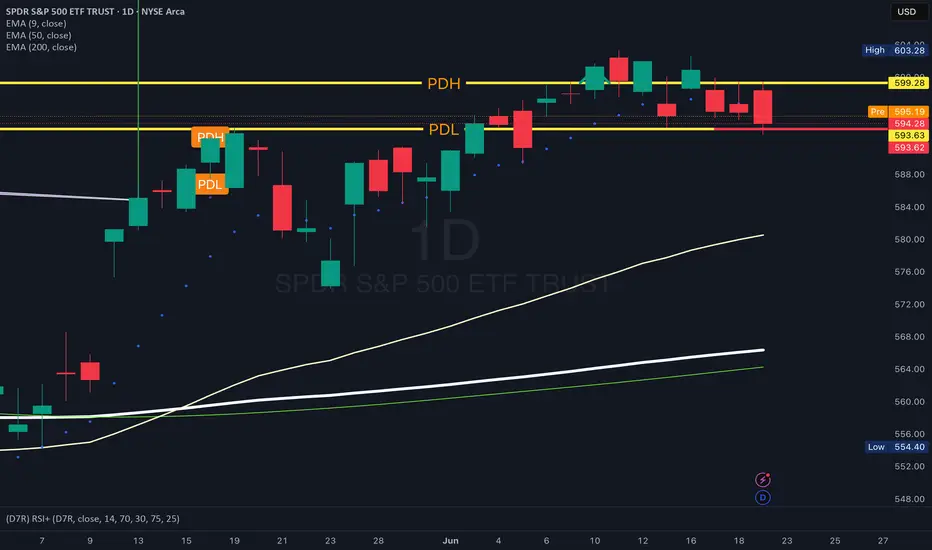
SPY: ASI DIMENTION SHIFT TRADESPY: ASI Dimension Shift Trade
Markets are no longer responding to human logic—they're reacting to macro compression and machine foresight.
This trade captures the inflection point where AI and capital collide.
📌 Watch:
AMEX:SPY holding above 532 = dimension support
Breakdown below 518 = confirmation of SMC exit
VolanX signal: “Shift registered. Volatility node expanding. Defensive alignment required.”
#SPY #VolanX #SMC #AITrading #ASIDimension #MacroBreakout #WaverVanir
SPY trade ideas

SPY At Risk as Geopolitical Tensions Rise Jun 23 — What Monday Holds for Bulls & Bears ⚔️📉
🔍 GEX & Options Sentiment Overview:
From the daily GEX chart:
* Key Gamma Levels:
* 📍Call Walls: 597 → 602 (supply zones), strong resistance.
* 📍Put Walls: 590 → 587 → 572, significant gamma exposure to the downside.
* High Volatility Zone (HVL) at 590 – a trigger level; under this, the market may accelerate downside toward 587 and even 572.
* GEX Summary:
* PUTS: 80.4% dominance
* GEX Net: 🔴 extremely negative
* IVR 23.3, still on the lower side but rising
* Implication: Dealers are hedging to the downside. Gamma exposure creates risk of accelerated selloff below 590.
📊 Technical Analysis – Daily (1D)
* Price: 594.28 (as of Friday close)
* Trend: Daily candle broke prior support; new lower high confirmed.
* Structure:
* Failed to reclaim 597, now acting as local resistance
* Next major demand zone: 587
* Trendline from the recent highs shows lower highs; bearish continuation forming.
* Volume: Bearish candle closed with strong volume — sign of institutional distribution.
⏱️ Intraday TA – 1H Chart
* CHoCH/BOS: Confirmed Break of Structure near 591, then a small rally attempt.
* Micro Supply Box: 596.5–597.5 — liquidity trap if SPY rallies into it.
* Support Zones:
* 593.35 / 594.00 – holding Friday’s bounce.
* If fails, expect sweep to 590 → 587.
* Trendline Pressure: Downward diagonal trendline rejecting every bounce. Unless a full candle close over 599.50, bias remains bearish.
⚠️ Geopolitical Risk – U.S. Bombs Iran
* News: U.S. launched targeted airstrikes on Iranian assets. Market now faces:
* Flight to safety: TLT, Gold, and USD may rise.
* Oil likely spikes — expect XLE and energy stocks to outperform.
* Tech and indexes may open with gap-down risk due to heightened geopolitical uncertainty.
* SPY Implications:
* Risk-off behavior could amplify sell-off under 590.
* Traders may hedge via VIX calls, gold futures, or SPY puts.
* Watch for VIX spikes or DXY rally as confirmation of sentiment shift.
🧠 Trade Scenarios – Monday June 24
🔻 Bearish Case (High-Probability if Geopolitical Escalates)
* Rejects at 596–597 zone (supply)
* Entry: ~595–596 rejection
* Targets: 590 → 587 → 572 (extreme GEX)
* Stop: 598.5–599.2 above supply box
🔼 Bullish Case (If Market Shakes Off Iran Tension)
* Breaks over 597.5, closes above 599.5 (CHoCH confirmation)
* Entry: 598–599 breakout
* Targets: 602 → 604.5 (2nd Call Wall)
* Stop: 596.5
📌 My Thoughts:
SPY is sitting on a knife’s edge. GEX is screaming downside, and now geopolitical risk adds another layer of pressure. Monday could open with volatility spikes, and if the market gaps down under 590, it might cascade to 587 fast.
Only a reclaim above 599.5 invalidates the bearish structure — and even then, macro headlines might limit upside. Stay nimble. Hedge if holding longs.
🧭 Action Plan for Monday:
* Scalpers: Watch the 596–597 rejection zone — quick puts may work well.
* Swing traders: Use HVL 590 as pivot. Lose it? Target 587.
* Hedgers: VIX calls or GLD may provide cushion.
* Macro watchers: Monitor oil (USO), DXY, and bonds (TLT) for risk-on/off cues.
⚠️ Disclaimer:
This analysis is for educational purposes only. It is not financial advice. Always do your own research and manage risk carefully.

SPY: Expecting Bullish Continuation! Here is Why:
Balance of buyers and sellers on the SPY pair, that is best felt when all the timeframes are analyzed properly is shifting in favor of the buyers, therefore is it only natural that we go long on the pair.
Disclosure: I am part of Trade Nation's Influencer program and receive a monthly fee for using their TradingView charts in my analysis.
❤️ Please, support our work with like & comment! ❤️

Low frequency trading (LFT) vs HFTHey fellow tarders and financial mojol,
I've got some insider info that's going to blow your minds! 🤯
According to my top-secret sources (aka my pet parrot who squawks numbers at me), low-frequency trading algorithms have finally figured out the true fair price of the S&P 500. Drumroll, please... It's $550! That's right, folks, all those high-frequency trading bots are currently aiming for this magical number as we speak.
But wait, there's more! The next step in this thrilling financial adventure involves radiowaving all the way down to $400. Yes, you heard it here first. We're talking about some serious next-level trading strategies that involve actual radio waves. Who needs fiber optics when you've got good old-fashioned radio, right?
So, buckle up and get ready for the ride of your life. The market's about to take a trip back to the good old days when $550 was the dream and $400 was just a stone's throw away.
Happy trading, and remember, if your broker gives you weird looks, just tell them you're tuning into the market's frequency! 📡💸

Friday updateSPY likely put in an ABC, I expect lower for most of today. Gold probably higher for now. Oil is just consolidating. NG looks like a buy. BTC i think will breakdown under 100k over the weekend.

bullish targets smashed ;)spy broke my bullish targets i posted when it was 500, now struggling with a lower high at resistance zone, push down to 572-580 or so is possible before they try to push for all time highs🚀
boost and follow for more 💖

SPY/QQQ Plan Your Trade For 6-20 : Pause Bar PatternToday's Pause Bar pattern suggests the SPY/QQQ will slide into a sideways type of PAUSE in price action today. I'm not expecting much to happen and if we do see any breakaway or breakdown trending it will likely be related to news.
While we have options expiration today and a host of other things that could drive the markets, I believe the markets are struggling to find direction right now. Thus, a pause in trading would be somewhat normal after a holiday-shortened trading week.
Gold and Silver are struggling after a brief rally last week. I believe this is fear related to the Israel/Iran conflict. Metals should continue to move higher.
BTCUSD is slightly higher (forgot to cover BTCUSD in the video), but not moving into a breakaway phase.
Overall, everything is very flat in early trading today. It may stay that way with my PAUSE BAR pattern.
Get some.
#trading #research #investing #tradingalgos #tradingsignals #cycles #fibonacci #elliotwave #modelingsystems #stocks #bitcoin #btcusd #cryptos #spy #gold #nq #investing #trading #spytrading #spymarket #tradingmarket #stockmarket #silver

Update on the Markets 7/3/25SPY got the pop up I was looking for - now the question is - does it hold and continue? Not sure yet. Gold could be bullish if it gets over 3370. Usoil had a pop but nothing screaming reversal yet. NG is in a wedge. BTC is at the top of it's range

Opening (IRA): SPY July 18th 495 Short Put... for a 5.13 credit.
Comments: Targeting the <16 delta strike paying around 1% of the strike price in credit.
Max Profit: 5.13
ROC at Max as a Function of Strike Price: 1.04%
Will generally look to roll up if the short put is in profit at 45 DTE or greater, add at intervals if I can get in at strikes better than what I currently have on at the June 513's and July 495's, and/or consider a "window dressing" roll (i.e., a roll down to a strike that is paying about the same in credit) to milk the last drops out of the position.

SPY the pattern was there I missed it.THe chart will always show you what it wants to do. You have to see it.

SPY 4HS TARGETSSPY 4H Chart (July 3, 2025)
📊 Trend: Bullish
📈 Current Price: 621.40
📅 Timeframe: 4H (swing trade outlook)
🔗 TradingView: alexpv73
📺 YouTube: @ozy-target

SPY 4HSResistance: 630 – Strong supply zone, potential profit-taking area.
Support Zone: Around 617 – Recently tested, holding as short-term support.
Gap: 615.03 → If SPY loses 617, watch for a retracement to fill the gap toward 615.
Major 4H Support: 610.17 – Institutional block. Losing this level would break the short-term bullish structure.

Long Trade Idea: SPY (S&P 500 ETF)!🧠
📅 Timeframe: 30-Minute
📈 Type: Long Position
📐 Setup: Tight consolidation breakout + bullish wedge pattern
📍 Trade Details:
Entry: $620.39 (breakout from rising wedge)
Stop Loss: ~$618.80 (below wedge support)
Target 1: $622.34 (minor resistance)
Target 2: $624.56 (major resistance zone)
🔎 Technical Breakdown:
Price formed a tight rising wedge, squeezing under resistance
Bullish breakout confirmed above consolidation
Strong uptrend continuation — higher highs + higher lows
SPY remains strong despite market hesitation
🎯 Risk/Reward Outlook:
Risk: ~$1.59
Reward: Up to ~$4.17
RR > 2.5:1 — ideal structure for breakout traders
💬 Caption (for Social/Chart Post):
“SPY breaks higher! 💥📈
Wedge breakout signals bullish momentum 🟢
Clean setup toward $624+ zone 🔓
Watch for continuation above $622.34!”
#SPY #LongTrade #BreakoutSetup #S&P500 #ProfittoPath #ETFTrading

SPY - TargetsWatching this wedge, Trump making headwinds with trade talks, striking a vietnam deal. Buyers still in control but hesitant, the "Big Beautiful Bill' being hashed out in the next couple of weeks. Could easily see a small pull back into the EMA's, Betting we see prices higher to the bullish target $700 if we can break above T/L with nice volume.

update on the markets 7/2/2025SPY continues to move up and I think a bit higher is likely still, although the bearish divergences are warning that another high may not hold. Gold may be bullish if it can push a bit higher. NG still looks bearish overall. USOIL also looks bearish. BTC is trying to breakout, but might not be able to just yet.

FED SPY INFLATION UNEMPThe variables attached have an important roll in economics stability.
Pay attention!

Nightly $SPY / $SPX Scenarios for July 2, 2025🔮 Nightly AMEX:SPY / SP:SPX Scenarios for July 2, 2025 🔮
🌍 Market-Moving News 🌍
🏭 U.S. Manufacturing Remains Under Pressure
The ISM Manufacturing PMI for June rose slightly to 49.0 from 48.5 in May—still in contraction territory. Tariff-induced uncertainty and rising input costs continue to weigh on factory activity, with new orders still weak and employment contracting
📈 Global Factory Rebound Led by India & Europe
While U.S. factories struggle, India hit a 14-month high in its manufacturing PMI at 58.4, and euro‑zone factory orders stabilized at 49.5—the first sign of recovery in over three years. Asia-Europe divergence may shift global capital flows .
🏦 Powell Says Tariffs Are Delaying Rate Cuts
Fed Chair Powell warned at the ECB forum in Sintra that elevated inflation—driven in part by Trump-era tariffs—has postponed the timeline for U.S. rate cuts. The Fed’s dot-plot now indicates only two cuts for 2025, with markets adjusting accordingly
💵 Dollar Nears 3½-Year Lows
The U.S. dollar weakened further, trading near a three-and-a-half-year low amid soft PMI data, a dovish Fed tilt, and renewed optimism over U.S.–Canada trade talks
📊 Key Data Releases & Events 📊
📅 Wednesday, July 2:
(No major scheduled U.S. economic data)
Market focus shifts to upcoming Nonfarm Payrolls on July 3, Powell's remarks, and trade-talk headlines.
⚠️ Disclaimer:
This information is for educational and informational purposes only and should not be construed as financial advice. Always consult a licensed financial advisor before making investment decisions.
📌 #trading #stockmarket #economy #manufacturing #Fed #inflation #charting #technicalanalysis

Update on the markets 7-1-2025SPX still floating but IWM and DJT are both having strong rallies, which usually means SPX will go higher today or tomorrow. Gold is at resistance. NG is a support. OIl still looks like a bear flag. BTC is pulling back from 107k - again.

~ June 19th 2025 - S&P 500 SPY ...new all time high ...S&P 500 SPY broke recent resistance 604.45 & closed above Feb 19th/ 25 all time high of 613.23 on Friday. Will be watching the open on Monday .... specifically Friday's all time high closing number 614.91

SPY soars to new all time highsThere has been a lot of speculation about where SPY is going next. I believe a significant correction will happen in the near future. However, today SPY is creeping back into the strong uptrend it once had. Looking at chart patterns, SPY is building momentum once more and will be hitting another yet another all time high.

Nightly $SPY / $SPX Scenarios for June 26, 2025🔮 Nightly AMEX:SPY / SP:SPX Scenarios for June 26, 2025 🔮
🌍 Market-Moving News 🌍
💱 Dollar Mounts Decline on Fed Credibility Concerns
The U.S. dollar dropped to a 3½-year low against the euro after reports that President Trump is considering replacing Fed Chair Powell as early as September or October. The move fueled market concern about the Fed’s independence and prompted traders to raise the likelihood of a July rate cut to 25%, with nearly 64 bps of rate cuts priced in by year-end
📉 Markets Stay Cautious Ahead of Powell’s Testimony
Traders remain on edge as Fed Chair Powell’s Capitol Hill testimony continues. He reiterated caution, noting inflation risks tied to tariffs despite growing calls for easing, keeping interest-rate expectations in limbo .
📈 S&P 500 Nears All-Time Highs in Second-Biggest Bi‑Monthly Rally
The S&P 500 has notched its second-largest May–June rally on record (6.2% in May, further gains in June), bolstered by cooling inflation, easing Middle East tensions, and strong AI earnings momentum led by Nvidia. Bull-case scenarios could push the index to fresh highs
📊 Key Data Releases 📊
📅 Thursday, June 26:
(No major U.S. economic release—markets are focused on Powell’s remaining testimony and global risk dynamics.)
⚠️ Disclaimer:
This information is for educational and informational purposes only and should not be construed as financial advice. Always consult a licensed financial advisor before making investment decisions.
📌 #trading #stockmarket #economy #Fed #inflation #geopolitics #technicalanalysis

SPY- Premarket readPre-Market Read – June 23
AMEX:SPY
Premarket High: 595.15
Premarket Low: 592.15
Bias: Leaning Bearish
Price got rejected again at that 600–602 zone — that’s been a wall.
All the EMAs (9/50/200) are stacked tight, which usually means something’s brewing.
Institutions bought heavy down around 572–579 — they’re already green, so they might start selling into strength.
I’m expecting chop between 593–595 off the open.
I’ll probably wait out the first 15 min and let the ORB build.
If we break out, I’m watching both sides, but I lean put.
579 spy incoming?I posted this a week or so ago. I think we are finally going to have the momentum, or lack thereof, to make it down to fill the rest of that gap. I have noticed that large gaps that leave a small gap below(you must adjust the indicator to show it) almost always get filled before continuing up. This 579 level also matches up perfectly with the 20ema on the weekly which should provide further support. I will be looking for this level all week while being aware of any short squeezes that could occur on the way down. Will definitely go long at this 579 level as I think we will have a very green July.
