Trend Change / Pullback$TER strong break of Mayor Resistance- MR (now minor support mS) and strong volume signal a trend change. Wait for a pullback at mS or a mayor moving average (20MA or 50MA)
TER trade ideas

Bullish - all set for $200?Monthly bullish candle. Buy any dip from here. Its involved in Robotic automation which is the future and going to see all robots doing the regular labor work in every industry.

$TER - symmetrical triangle break out watch. Target - $144, $155Close to breaking out of symmetrical triangle.
Validation point - $133
Target 1 - $138.42
Target 2 - $144
Target 3 - $155
———————————————————
How to read my charts?
- Matching color trend lines shows the pattern. Sometimes a chart can have multiple patterns. Each pattern will have matching color trend lines.
- The yellow horizontal lines shows support and resistance areas.
- Fib lines also shows support and resistance areas.
- The dotted white lines shows price projection for breakout or breakdown target.
Disclaimer: Do your own DD. Not an investment advice.


Golden Zone + Long term uptrendThe price is approaching the golden zone as well as its long term trendline which was used so far for this strong uptrend.


TERADYNE broke out and is showing bullish price actionNASDAQ:TER broke out from the head and shoulders pattern and is now targeting 111$, but the pullbacks towards 93$, stop loss level around 84$. This is a great stock that can be held for long term.
Hit the like button please if you find this useful :)
This is only my own view and not a financial advice, do your own analysis before buying or selling
Happy Trading!

Cup and Handles Ascending TriangleTER is traveling in a channel that may be slightly narrowing but only slightly. During last pull back to 73.9ish it still rode the bottom trendline of this channel. I hesitate to call it a rising wedge at this point, just something I am watching.
Short interest is higher than I thought it would be so I analyzed this chart to see why. (Short interest is the percentage of share float that has been sold short but has not yet been covered or closed out. Short interest is an indicator of market sentiment. Extremely high short interest shows investors are very pessimistic.) Short interest is only 4.79% but a little higher than I thought it may be
Rising wedges can be bearish but are only valid if bottom trendline is broken. This trendline has not been broken.
There is an old high from 1999 of 115.44 that some do not find significant because it was so long ago. I think the market has a way of remembering stuff from 1999 so I am thinking there may be R there (Resistance)
TER broke up from an ascending triangle at 94ish. This upper trendline can provide support (S) later on. Both handle lows can also provide support
50 SMA is pointing up and looks as if it will cross up through the 100 sma
Realizing T2 (targets 2) are long term targets, pick an entry point that works for you if you like this stock. Pull backs always happen so I try to buy red and sell green. Support looks strong at 91to92ish and at 97ish. There are many levels of S in any chart. I look at charts like an x-ray of supply and demand.
I am watching for a pull back
Being right is a good thing, but the action you take when you are right is what counts (o:

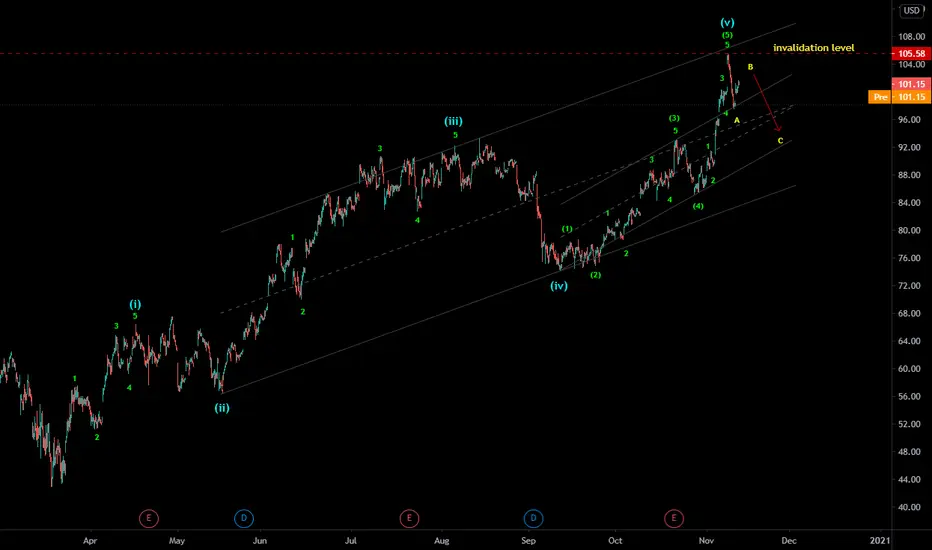
TER - Elliottwave analysis - Bear case TER - It seems the impulse cycle in 4 hr time frame finished and now it should start correcting down unless it extend further. So sell it with high as stop level 105.63 near 102-03 level for correction down, which should probably go down up to 94.50 level initially. There is always an alternative count, which will go higher if price break above the high.
Give thumbs up if you really like the trade idea
TER - Elliottwave analysis - 5th wave upTER - It is in strong up trend and in impulse cycle from Covid low. It is in 3rd of 3rd wave up and after small correction will make new high to complete the 3rd of 5th wave in 4 hr time frame. Buy in three wave pull back of 4th subwave of 5th wave up until price remains above 93.11 level. It is outperforming the SPX and NDX both.
Give thumbs up if you really like the trade idea.

Teradyne - Cup & Handle + Measured MoveTeradyne made a cup & handle, which continues to see strength.
Cup & Handle -- Measured Move
Making a measured move from the floor of the cup, to the resistance which was all time highs, we get a 18 points (12% aprox.) potential move.
Trade
Would follow the 5sma (green line) to take profits for 50% of my position, the other 50% if it takes the Resistance 1 level.
There are also other semiconductors making ATH, which is adding to the strength in the industry overall.

$TERPosition :
Entry price: 89.57
SL: 85.74 (-4.28%)
TP: 101.05 (+12.82%)
R:R: 3.
Fundamentals :
Sector: Semiconductors - Semiconductor Testing Equipment & Service
EPS % Chg (Last Qtr): 53%
3 Year EPS Growth Rate: 24%
EPS Est % Chg (Current Yr): 59%
Sales % Chg (Last Qtr): 41%
3-Year Sales Growth Rate: 11%
Annual Pre -Tax Margin: 25.8%
Technicals
Cup with handle - handle breakout

$TER posted slightly better earnings.$TER posted better than expected earnings, With PEAD projecting a bullish sentiment for the stock price. with price trading on the lower boundary of the projected cone.

TERADYNE showing bullish price actionNASDAQ:TER seems to have bottomed out for the short term ahead with a bullish divergence on the RSI supporting the mode, anticipated pattern shown on the graph. The stock is targeting 81$ and 82.7$.
Hit the like button please if you find this useful :)
This is only my own view and not a financial advice, do your own analysis before buying or selling
Happy Trading!

TER:NASDAQ - TERADYNE INC - S&P 500 and 20% swing trade?Teradyne along with Etsy and Catalent was added to the S&P 500 index by the committee effective Sept. 21. Just looking at the chart it looks like it was comfortably pushing the $90 mark before the big tech stock correction. Entry into the S&P 500 will mean a bunch of ETFs and funds will be looking to add it to their collections so could further help its chances of a move up. Ive put an alert in at $78, but could equally place a stop-limit order to take a position if it heads in the right direction. Might get shaky up around that $90 mark. Be interesting if the index addition can push it through that level or not. Need to take into account the wider market volatility too of course and hope we dont correct again after this recent bounce. Worth a look.


Time to fade out?Roughly 7-9 year fade-out after every peak. Is this time going to be different? Time would tell, either way I am personally skeptical buying at this level.

Cup and HandleNo rising wedges noted. RSI pointing down so possible a pull back coming. One thing I have noticed about RSI, is it can change directions daily sometimes! LOL
Monthly candle is a red doji so not help. NV is high. Bollinger bands are contracting so it is consolidating
Not a recommendation
