TESLA 1D Bullish scenarioTesla shares have broken their bearish structure on the daily timeframe after filling the previous price gap and have a potential to grow by 50% despite a positive divergence.
TSLA trade ideas

TSLA: Low Is In , Rally IncomingTSLA is showing signs of strong accumulation, with buyers consistently stepping in and volume expanding on up-moves. Price structure is improving, breakouts further confirm strength, increasing the likelihood that bears have been left behind. Based on the price action and volume alone, TSLA looks ready for a potential sustained move higher.

Tesla is Going to 303 + Looks like Tesla is going to 303 or possibly higher
Kris/Mindbloome Exchange
Trade Smarter Live Better

Al' set Tesla?Tesla. Take me to "Higher Highs Lane". I believe support is dominate in this case and will most likely send Tesla to new highs. Who knows, Elon may be the first trillionaire.

Tesla short
tesla will go further down
just few reactions from baseless fundamental
aiming at 240-260

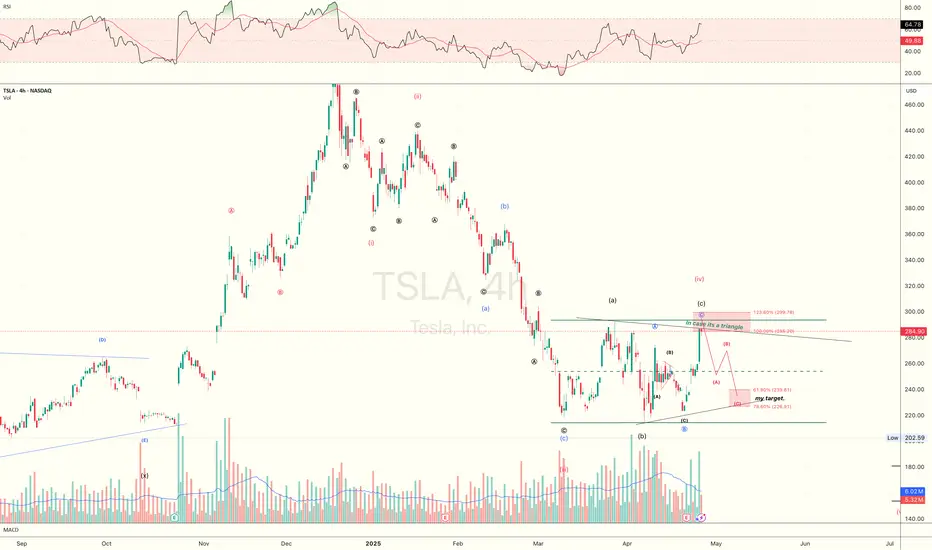
TeslaI hope y'all had the opportunity to buy into Tesla last week. As for me, I bought in @ $237 and sold @ 284.20. I only had 25 shares but made a nice 20% profit in about one week. It's trades like these that build your account and create wealth in the very long-term. Yes, I sold before we made it into the target box, but you have to remember, this is a larger (B) wave we're currently in. They can be very complex and unpredictable at times. Price is right in the area of the 0.382, it hit the smaller red 1.0, and has made a new high above the a wave made on 09 April. I would like to see it breach the (a) wave high of 25 March, but that isn't required. This means it has all the pre-requisites of completion. Will it hit the target box for another high? I think so, but I'm not greedy or try to top tick. 20% profit is good enough for me. The last thing I want to happen is the volatility of Tesla kick in and lose all the profits I just made. Don't be so scared of missing POTENTIAL profits that is causes you to lose the ones you ALREADY earned.
All that being said, I find it likely that we make another high into the target box due to the structure. It looks like it needs one more slight high. The red box is the "sweet" spot, but price can top at any moment. Also, if you look at MACD, it is coming into the trend line and thus is running into resistance. This should make you think a local top is near if not already struck. Let me know if y'all have any questions.
P.S: Don't ask me if you should sell. I already stated I sold my shares and cannot give you financial advice. Trade according to your own portfolio / risk tolerance.

TSLA BUYTesla isn't just a car company anymore — it's becoming an AI and robotics powerhouse. With the launch of the Tesla Bots “Optimus" and the upcoming RoboTaxi network, they're tapping into two trillion-dollar industries: robotics and autonomous transportation. All upside from here.
TESLA: Short Trade Explained
TESLA
- Classic bearish formation
- Our team expects pullback
SUGGESTED TRADE:
Swing Trade
Short TESLA
Entry - 284.90
Sl - 298.09
Tp - 256.85
Our Risk - 1%
Start protection of your profits from lower levels
Disclosure: I am part of Trade Nation's Influencer program and receive a monthly fee for using their TradingView charts in my analysis.
❤️ Please, support our work with like & comment! ❤️

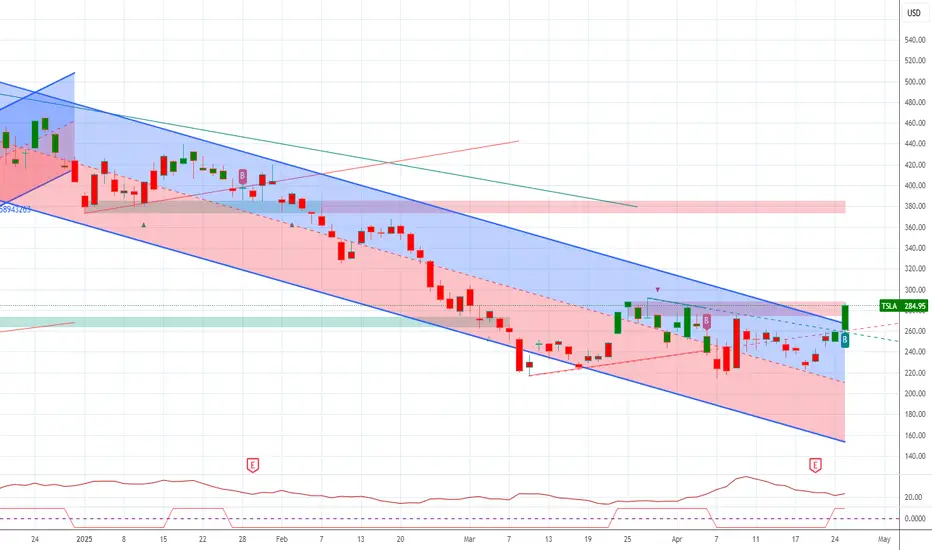
Short term TSLA Price best guess road mapattached a TSLA trading road map; It will be fun to see if this is how things play out.short term: 1st try arrow now starting Mon small pullback, start up Tuesday peak by May 2?
Then pullback Starting May 2-3 Mid Mayto 288 chop for a week then back up ( if the market tanks to new lows then the red alternate arrow is more likely as all stocks strong and weak are sold.)
If TSLA holds 288 area then back up By July1 into about to early July (2nd try arrow)If iTSLA can do this and broad market isn't a mess then 400 will be reached in months ahead

TSLAThe Future of Tesla Stocks: 2025 Outlook
Current Situation
As of late April 2025, Tesla (TSLA) is trading at approximately $284.95, with notable volatility
Bullish scenarios: Some forecasts see TSLA reaching $360 or even as high as $800.70 by year-end, especially if Tesla executes well on new products and technology.
Bearish scenarios: More cautious analysts, such as those at Wells Fargo, warn of a possible drop toward $130 if deliveries and margins disappoint, citing intense competition and slowing demand.
Most forecasts for 2025 fall between $284 and $800, highlighting high uncertainty and volatility in the stock’s outlook.
Key Drivers for Tesla’s Stock Performance
1. Vehicle Deliveries and Production
Tesla is expected to deliver between 1.95 million and 2.5 million vehicles in 2025, with growth driven by new models like the Cybertruck and more affordable vehicles.
Any production setbacks or failure to meet targets could pressure the stock.
2. Technological Innovation
Success in rolling out Full Self-Driving (FSD) features and the anticipated Robotaxi service could be transformative, potentially boosting profit margins and investor sentiment.
However, delays or regulatory hurdles could dampen optimism.
3. Competition and Market Share
Tesla faces growing competition from legacy automakers and new EV entrants, especially in China and Europe.
Its EV market share has slipped below 50% in key regions, raising concerns about sustaining growth.
4. Financial Performance
Revenue is projected to grow by 17.5% to $117.2 billion in 2025, with EPS also expected to rise.
Margins are under pressure due to price cuts and rising costs, a key risk factor.
5. External and Market Risks
Macroeconomic conditions, such as interest rates and consumer demand, will influence stock performance.
CEO Elon Musk’s leadership and public perception remain influential but can also be a source of volatility.
Long-Term Potential: Despite short-term risks, many analysts consider Tesla a strong long-term play due to its innovation and brand strength.
Conclusion
The future of Tesla stock in 2025 is highly uncertain, with forecasts ranging from significant gains to steep declines. Key factors include delivery growth, technological breakthroughs, margin management, and competitive pressures. While the long-term outlook remains positive for many analysts, short-term risks and volatility should not be underestimated. Investors should monitor Tesla’s execution on new products, regulatory developments, and broader market trends for directional cues.

TESLA Stock Chart Fibonacci Analysis 042525Trading Idea
1) Find a FIBO slingshot
2) Check FIBO 61.80% level
3) Entry Point > 260/61.80%
Chart time frame: B
A) 15 min(1W-3M)
B) 1 hr(3M-6M)
C) 4 hr(6M-1year)
D) 1 day(1-3years)
Stock progress: A
A) Keep rising over 61.80% resistance
B) 61.80% resistance
C) 61.80% support
D) Hit the bottom
E) Hit the top
Stocks rise as they rise from support and fall from resistance. Our goal is to find a low support point and enter. It can be referred to as buying at the pullback point. The pullback point can be found with a Fibonacci extension of 61.80%. This is a step to find entry level. 1) Find a triangle (Fibonacci Speed Fan Line) that connects the high (resistance) and low (support) points of the stock in progress, where it is continuously expressed as a Slingshot, 2) and create a Fibonacci extension level for the first rising wave from the start point of slingshot pattern.
When the current price goes over 61.80% level , that can be a good entry point, especially if the SMA 100 and 200 curves are gathered together at 61.80%, it is a very good entry point.
As a great help, tradingview provides these Fibonacci speed fan lines and extension levels with ease. So if you use the Fibonacci fan line, the extension level, and the SMA 100/200 curve well, you can find an entry point for the stock market. At least you have to enter at this low point to avoid trading failure, and if you are skilled at entering this low point, with fibonacci6180 technique, your reading skill to chart will be greatly improved.
If you want to do day trading, please set the time frame to 5 minutes or 15 minutes, and you will see many of the low point of rising stocks.
If want to prefer long term range trading, you can set the time frame to 1 hr or 1 day.

$TSLA : The road to 400 $In this space we have discussed about NASDAQ:TSLA multiple times. In one of our very recent blogs on 21 April 2025, we flipped bullish for the first time and presented a case to accumulate NASDAQ:TSLA between 214 $ – 250 $. Congrats to everyone who did it. On Friday’s close the stock is above 250 $ and its currently sitting above its 20-Day and 50-Day SMA. This can be taken as a first bullish sign and maybe the start of a primary reversal trend towards up. After some turbulent time and more than a 50% dip the stock is holding up very well.
As Elon will be back on the helm of the NASDAQ:TSLA we can expect some more macro tailwind for the stock itself. In the daily chart below, we see that the RSI chart has flipped bullish and on the Fib retracement levels we are well above the 0.382 Fib retracement levels which is at 272 $. The next stop as per the chart is 310 $ @ 0.5 Fib level. My assessment is that once the momentum is flipped bullish the stock can end above 400 $ once this is all said and done.
Verdict: Go Long $TSLA. 400 $ see you there $TSLA.

TslaKing of the Meme....
Abysmal quarter and guidance yet stock is holding 😆...
Keep it simple, I think tsla will test its 200ma this week at 291, from there we should see a reactionary pullback.. As long a 275 holds, then 315-318 is next up ..
Below 275 and 250 comes next ..
The full measure move here would be 360.. but that only comes if AMEX:SPY is headed back to 580.. 😉

Either a triangle start forming or a flat just completed. $TSLAThe Friday bounce was huge and expected, but be really cautious as its very a typical Tesla move.
At this point, i believe the triangle to be complete in next 2-3weeks(likely), or a flat just complete(also acceptable though i'm leaning less toward this scenario).
And, I bought puts yesterday, let's see what this plays out.
Just sharing my honest thought here, feel free to challenge my view and post opposing counts, always willing to learn new knowledge.
Tesla 286,290 cross can create a stronger moveTesla 286,290 cross can create a stronger move. Tesla has been consolidating and is down 40%. With robotaxi and optimus, it is on the verge of breakout

𝗧𝗲𝘀𝗹𝗮 𝗕𝗿𝗲𝗮𝗱𝗸𝗼𝘄𝗻: Priced for perfectionPriced for perfection in an imperfect market
NASDAQ:TSLA nearly hit its 200dma and key resistance area (~288–292) after a roughly 20% post-earnings squeeze, and as long as it stays below that level, it risks retesting the long-term uptrend line that has marked major lows twice since COVID.
𝘛𝘢𝘳𝘪𝘧𝘧 𝘢𝘯𝘥 𝘴𝘶𝘱𝘱𝘭𝘺-𝘤𝘩𝘢𝘪𝘯 𝘳𝘪𝘴𝘬: Tesla depends heavily on Chinese-made battery and electronic components now hit by reciprocal U.S. tariffs, while over 60% of global neodymium and dysprosium—vital for its EV motors—are mined and processed only in China, creating a critical bottleneck that could sharply elevate its input costs.
𝘔𝘢𝘳𝘨𝘪𝘯 𝘱𝘳𝘦𝘴𝘴𝘶𝘳𝘦 𝘷𝘴. 𝘭𝘰𝘧𝘵𝘺 𝘷𝘢𝘭𝘶𝘢𝘵𝘪𝘰𝘯: Q1 price cuts of up to 20% on core models drove Tesla’s auto gross margin to its lowest since 2020, calling into question the sustainability of its >70× forward P/E multiple, which assumes exceptionally high profits from future ventures like robotics and autonomous fleets.
$NQ_F NASDAQ:NDX NASDAQ:QQQ NASDAQ:AMZN NASDAQ:META NASDAQ:NVDA NASDAQ:SOX $ES_F AMEX:SPY SP:SPX TVC:DXY NASDAQ:TLT TVC:TNX TVC:VIX #Stocks #TrumpTariffs 🇺🇸 #ChinaTariffs 🇨🇳

TSLA
TSLA Did break through a resistance line but this amount of price volitlity was unexpected, there is a big resistance line at around 287-288. Price will most likely consolidate or bounce down. Price could breakthrough and bounce back then continue on upwards. I have never seen this before not even with the Covid crash. Someone else probably has but I sure haven’t. I will probably buy the rebound if it breaks through and enter a long position but as of right now unsure.
NASDAQ:TSLA

Quick correctionI bough some puts form 05/02 strike 242.5. I think is going to respect that resistance in short term. I'll take the loss if it breaks up that resistance. Also SPY is hitting a resistance zone. We might see a pull back soon.

TSLA, the king of all meme stocksYesterday, Q1 earnings call. Stock misses earnings by 30% on already reduced expectations of 0.38. Had it been earnings expectations from a week before (which was 0.434), it would've missed by around 45%.
Still, the stock manages to rebound from mid 220s up to 257 in a single day (around 10%). It's impressive, but still looms a ceiling just up ahead (258-260) which I think is the perfect opportunity to short. Will be invalid if it manages to push up above 267.6 which is the local resistance line and a major historic resistance also.
That said. I think the odds are good in shorting around 258-260. Expecting a fall towards low 200s and even towards high 170s.

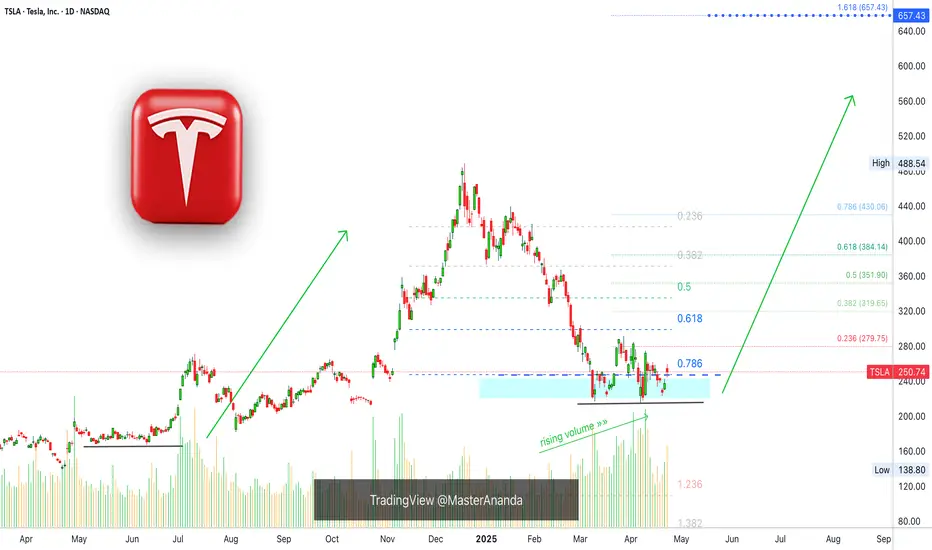
Tesla Finds Support, 657 Next Easy High & All-Time HighTesla is looking pretty good right now, support has been found. The correction amounted to -55.5%. It started in mid December 2024 and the first low was hit in March 2025.
Since March TSLA has been in the process of forming a bottom.
The action moved below 0.786 Fib. retracement level in relation to the last bullish wave. The action is back above this level now and this is pretty good. As long as the action happens above the magic blue dashed line, Tesla is good and set to grow.
This signal, perfect symmetry, is supported by rising volume.
Buy volume is rising massively as TSLA moves into a long-term support zone.
(Smart people, smart money and smart traders buy when prices are low —this volume signal reveals the highest buying in years as TSLA hits support.)
The most revealing fact from a logical standpoint is the size of the correction, a 55% correction is a lot by any standard. When a market goes through such a strong correction, it tends to reverse and produce next a new move. It moves in waves. It goes up and down, up and down. We are seeing the end of the down-move and this will automatically lead to an up-wave.
When the bottom was hit, last month, the action goes flat. Tesla was clearly moving lower but as support was found the bottom stays flat. This is another revealing signal for the logical mind. No longer a downtrend but a consolidation phase, which is part of a transition period.
» So the market was bullish and from bullish turned bearish, from bearish it went sideways and from sideways it will grow.
This is an easy buy.
Thanks a lot for your comment and continued support.
Namaste.
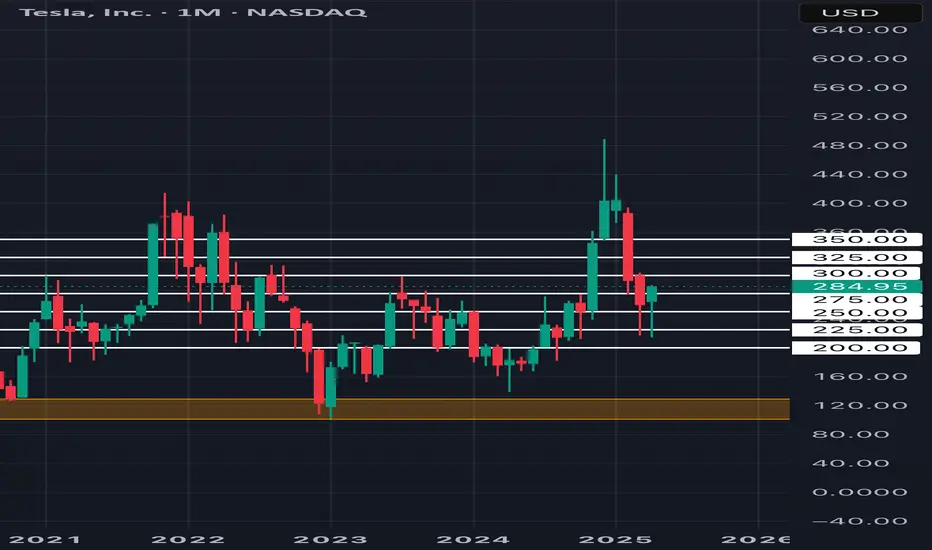
Tesla: At a Crossroads – Accumulation or Breakdown?One of the most talked-about stocks right now — Tesla NASDAQ:TSLA . And for good reason. Between the constant media buzz around Elon Musk and the recent surge in vandalism against Tesla vehicles, it’s been getting plenty of attention. But I’m not here to talk politics or headlines — I’m here for the chart.
And honestly? It’s looking better than you’d think. Despite all the noise, price has held steady in the $225 to $270 range, showing signs of a sideways accumulation phase — right at the Point of Control (POC) since 2021. That’s a pretty strong area, technically speaking.
Over the next few weeks, we’re likely to get clarity:
Either we break above $350, which opens up serious upside potential,
Or we break down toward the Volume Area Low — specifically the 2024 VAL at $161.18.
The real danger zone? Below $138. If price breaks that level, we have to assume that Wave 2 isn’t done yet — even though it was originally considered complete in 2023.
Until then, the structure actually looks constructive: we’ve been putting in higher lows and higher highs since 2023, which signals a potential uptrend.
How far that uptrend goes is hard to call. But if we break and hold above $325, then a pullback toward $300–$270 could offer a clean entry opportunity.
On the flip side, yes — if the market collapses and Wave II is still unfolding, we could be staring at $175, $125, or even as low as $75–$50 in an extreme scenario. And that would be wild for a stock that once touched $485.
But that’s why it’s crucial to zoom out. Ask yourself:
What do I want from Tesla — long-term conviction or short-term plays?
Then build your view. If the macro fits, dial into the lower time frames to find your edge. The setup is building — and it’s looking like Tesla is prepping for a big move.
Question is: which direction are you positioned for?

9 Simple Ratios Every Great Investor Uses - Buffett Included!Forget the hype, headlines, or hope. These 9 financial ratios are what real investors actually use to pick winners, but...
P/E? ROE? EPS? 🧐
- What are they, or better yet, WHO are they? 🤯
- How high is “too high”?
- Is a low number always good, or just a trap?
- Do all industries follow the same rules… or is that another myth?
Buffett. Greenblatt. Graham. Lynch.
They didn’t rely on vibes — they trusted fundamentals
After years of relying on charts, I built a 9-point fundamentals checklist to filter stocks faster and smarter. Now I’m sharing it with real-life examples and key insights to help you spot what really makes a stock worth owning:
Easy enough for new investors diving into fundamentals
Sharp enough to level up seasoned pros
Real enough to avoid hype
…but the truth is: these numbers did flag companies like Amazon, Apple, and Nvidia before the market gave them credit.
-----------------------------------------------------
✅ Quick Reference Table
Scan the table, then dive into the stories…
First Pro Tip: Bookmark this. You’ll check these before every stock pick.
-----------------------------------------------------
📊 1. P/E Ratio | Price-to-Earnings
What it tells you: How much you pay for each dollar of a company’s profit.
Short Example: A P/E of 20 means you pay $20 for $1 of profit. High P/E? Expect big growth or risk overpaying.
Strong: Between 15 and 25
Caution: Above 30 (unless fast growth)
Industry Averages:
- Tech: 25–40
- Utilities: 10–15
- Consumer Staples: 15–20
- Energy: 10–20
- Healthcare: 20–30
Story: In early 2023, NVIDIA’s P/E ratio hovered around 25, near the low end for tech stocks. Investors who saw this as a steal amid the AI boom were rewarded—NVIDIA’s stock made 4x by the end of 2024 as AI chip demand soared.
Contrast that with Tesla in Q1 2025, when its P/E spiked above 40 with slowing sales and Tesla’s stock dropped 50% in weeks.
Pro tip: A low P/E is not always good. If growth is weak or falling, it's often a trap.
Example: A utility company with a P/E of 30 is probably overpriced. A tech stock with 35 might still be fair — if growth justifies it.
-----------------------------------------------------
🧠 2. PEG Ratio | Price-to-Earnings-to-Growth
What it tells you: If a high P/E is worth it based on future profit growth. Whether the earnings growth justifies the price.
Short Example: A PEG below 1 means you’re getting growth at a fair price. High PEG? You’re overpaying.
Strong: Below 1
Caution: Above 2
Industry Averages:
- Software: below 1.5 is solid
- Consumer Goods: Below 2 is more realistic
- Tech: Below 1
- Consumer Staples: Below 1.5
- Healthcare: Below 1.2
- Financials: Below 1.5
- Energy: Below 1.3
Story: In mid-2022, Salesforce’s PEG was 0.8 (P/E 35, forward EPS growth 45%) as cloud demand surged. Investors who spotted this steal saw the stock climb 130% by the end of 2024. Meanwhile, Peloton in 2023 had a P/E of 20 but near-zero growth (PEG above 3). Its stock cratered -50% as fitness trends faded.
Story: NVIDIA’s PEG hit 0.9 in Q3 2023 (P/E 30, growth 35%) during AI hype, a steal for tech (average PEG below 1.2).
PEG filters hype. A stock can look expensive until you factor in growth.
-----------------------------------------------------
🧱 3. P/B Ratio | Price-to-Book
What it tells you: How much you pay compared to what the company owns (like buildings or cash).
Short Example: A P/B below 1.5 means you’re paying close to the company’s asset value. High P/B? Expect strong profits or risk.
Strong: Below 1.5
Caution: Below 1 + poor earnings = value trap
Industry Averages:
- Banks: Below 1.5
- Insurance: Below 1.3
- REITs: Use NAV (aim below 1.2)
- Tech: Often ignored
- Energy: Below 2
Story: In 2024, JPMorgan Chase’s P/B was 1.4, solid for banks (average below 1.5). Investors who bought enjoyed 100% gains.
n 2023, Bed Bath & Beyond’s P/B fell below 1 with collapsing earnings. It looked cheap but filed for bankruptcy that year.
Tip: Only use this in asset-heavy sectors like banking or real estate.
-----------------------------------------------------
⚙️ 4. ROE | Return on Equity
What it tells you: How well a company turns investor money into profits.
Short Example: An ROE above 15% means the company makes good money from your investment. Low ROE? Weak returns.
Strong: Above 15%
Caution: Below 10% unless in slow-growth industries
Industry Averages:
- Tech: 20–30%
- Consumer Staples: 15–25%
- Utilities: 8–12%
- Financials: 10–15%
- Healthcare: 15–20%
Story: Coca-Cola (KO) has kept ROE above 35% for years, a sign of brand power and pricing strength.
Eli Lilly’s (LLY) ROE stayed above 25% from 2022–2024, a healthcare leader (average 15–20%). Its weight-loss drug Mounjaro drove consistent profits, lifting the stock 150%+ in two years. Checking ROE trends helped investors spot this winner.
Tip: If ROE is high but D/E is also high, be careful, it might just be leverage.
-----------------------------------------------------
💰 5. Net Margin | Profitability
What it tells you: How much profit a company keeps from its sales or what % of revenue ends up as pure profit.
Short Example: A 10% margin means $10 profit per $100 in sales. Low margin? Tough business or high costs.
Strong: Above 10-15%+
Caution: Below 5%
Industry Averages:
- Software: 20–30%
- Retail: 2–5%
- Manufacturing: 8–12%
- Consumer Staples: 10–15%
- Energy: 5–10%
- Healthcare: 8–15%
Story: Walmart’s (WMT) 2% net margin looks tiny — but it’s expected in retail.
A software firm with 5%? That’s a warning — high costs or weak pricing.
In 2023, Zoom’s (ZM) net margin fell to 5% (down from 25% in 2021), well below software’s 20–30% average. Pricing pressure and competition crushed its stock quite a lot. Meanwhile, Apple’s 25% margin in 2024 (tech average 20%) remained a cash cow.
Tip: Margins show whether the company owns its pricing or competes on price.
-----------------------------------------------------
💣 6. D/E Ratio | Debt-to-Equity
What it tells you: How much debt a company uses compared to investor money.
Short Example: A D/E below 1 means more investor cash than debt. High D/E? Risky if profits dip.
Strong: Below 1
Caution: Above 2 (except REITs or utilities)
Industry Averages:
- Tech: 0–0.5
- Industrials: 0.5–1.5
- REITs: 1.5–2.5 (manageable due to structure)
- Utilities: 1–2
- Energy: 0.5–1.5
Story: In 2024, Tesla’s D/E dropped below 0.3 (tech average 0–0.5) as it paid down debt, signaling strength despite sales dips - a massive rally afterward.
Tip: Rising debt + falling profits = a storm coming. Always check both.
-----------------------------------------------------
💵 7. Free Cash Flow (FCF)
What it tells you: Cash left after paying for operations and growth investments.
Short Example: Apple’s $100 billion cash pile in 2024 funded stock buybacks, boosting shares. Low cash? Trouble looms.
Strong: Positive and growing
Caution: Negative for multiple years
Sector notes:
- Tech: Lots of cash (think billions)
- Industrials: Up and down, check trends
- REITs: Look at FFO (cash from properties), aim high
- Energy: Has cash, but swings with oil prices
- Healthcare: Steady cash, not too high
Story: Netflix had negative FCF while scaling content. Once costs stabilized, FCF turned positive and stock re-rated sharply.
Pro tip: Profits don’t mean much without real cash. FCF is often more honest.
Cash is king: Companies need cash to pay bills, reduce debt, or fund growth. If FCF is falling, they might be burning through cash reserves or borrowing, which isn’t sustainable.
Potential issues : This mismatch could signal problems like poor cash collection, heavy spending, or even accounting tricks to inflate profits.
-----------------------------------------------------
🚀 8. EPS Growth | Earnings Power
What it tells you: How fast a company’s profits per share are growing.
Short Example: EPS up 10% yearly means more profit per share, lifting stock prices. Flat EPS? No growth, no gains.
Strong: Above 10%
Caution: Below 5%, flat/negative for 3+ years
Industry Averages:
- Tech: 15–30%
- Staples: 5–10%
- REITs: 3–6% (via FFO growth)
- Healthcare: 10–15%
- Financials: 5–10%
- Energy: 5–15% (cyclical)
Story: In Q1 2024, NVIDIA’s forward EPS growth of 30% (tech average 20%+) fueled a rally as AI chips dominated. Checking forward estimates helped investors avoid traps like Intel, with flat EPS and a drop.
Pro tip: A stock with flat EPS and no dividend? There’s no reason to own it.
-----------------------------------------------------
💵 9. Dividend Yield | Passive Income
What it tells you: How much cash you get yearly from dividends per dollar invested.
Short Example: A 3% yield means $3 per $100 invested. High yield? Check if it’s sustainable.
Good: ~3–4%
Red Flag: Above 6% with a payout ratio above 80-90%
Industry Averages:
- Utilities: 3–5%
- REITs: 3–6%
- Consumer Staples: 2–4%
- Tech: 0–2%
- Energy: 2–5%
-----------------------------------------------------
💡 Final Thought: How to Use All of This
Top investors don’t use just one metric. They look at the whole picture:
Good growth? Check PEG.
Good profits? Confirm with ROE and margin.
Safe balance sheet? Look at D/E and cash flow.
Fair valuation? P/E + FCF Yield + P/B.
Real power = Combining metrics.
A company with P/E 15, PEG 0.8, ROE 20%, low debt, and positive FCF? That’s your winner.
A stock with P/E 8, but no growth, high debt, and negative cash flow? That’s a trap.
-----------------------------------------------------
Real-World Combos
🎯Winners:
Tech Gem: P/E 20, PEG 0.8, ROE 25%, D/E 0.4, growing FCF, EPS 20%+ (e.g., NVIDIA 2023: AI-driven growth, stock soared).
Energy Steal: P/E 15, P/B 1.5, FCF positive, Dividend Yield 3.5% (e.g., Chevron 2023: Cash flow king).
⚠️Traps:
Value Trap: P/E 8, flat EPS, D/E 2.5, negative FCF (e.g., Peloton 2023).
Overhyped Tech: P/E 50, PEG 3, Net Margin 5%, D/E 1.5 (e.g., Rivian 2024).
-----------------------------------------------------
🚀 Share your own combos!
What do you personally look for when picking a stock?
If you spotted something off in the numbers, or have a valuable insight to add — please, drop it in the comments.👇
💡 Let’s turn this into a thread that’s not just good but superb and genuinely helpful for everyone.
-----------------------------------------------------
Final Thought
“Buy great companies at fair prices, not fair companies at great prices.” – Warren Buffett
This guide gives you the map.
Charts, tell you when.
These numbers tell you what, and why.
And this post?
It’s just the beginning!
These 9 metrics are part one of a bigger series I’m building — where we’ll go even deeper, with more advanced ratios, smarter combos, and real case studies.
If this guide helped you see financial numbers a little clearer, there’s a good chance it’ll help your investor friend too, especially if they’re just starting their journey...🤝Share it with them!
I built this as much for myself as for anyone else who wants to get better.👊
If you made it this far — thank you! 🙏
...and super thankful if you hit "The Boost" on this post 🚀
Cheers,
Vaido
