TSLA is coming down to my buy zoneTSLA is coming down to my buy zone. I will be accumulating at 229 and below.
I will start first by selling cash covered naked puts to collect credits until it drops to that zone. The goal is to get assigned with the naked put options at a cost of 229 and below to purchase TSLA shares.
There is a good possibility that the next earnings of TSLA will disappoint and we might get a quick dip. In that case we may even see early 200s. I would be adding more shares there.
Note that this is a weekly chart so it will take some time to play out.
This is a long term hold for me.
Upside Target:
- Nearest upside target is 11.9% above the current price, approximately $267.86.
Downside Target:
- Nearest downside target is -1% below the current price, approximately $237.04.
- Next downside target is approximately $195.65-196
- Support and Resistance: Monitor the support at $217.02 and resistance at $291.85 for potential breakouts or breakdowns.
- Action: Given the bearish sentiment, consider waiting for a clearer bullish signal or confirmation of support holding before entering long positions. Up Volume to Down Volume Ratio 30-Days is 0.86 and 50-Days is 0.78, both below 0.8, indicating bearish sentiment in the near term so wait for it to come down to the buy zone.
TSLA trade ideas

TSLA looking for a bounce in the buyer's garageOn the NASDAQ:TSLA 1W chart, the price is currently pulling back below the 78.6 Fibonacci retracement level after a significant move up, and the zone between 224 and 182 presents an attractive area for potential long entries. The Ichimoku cloud (10, 20, 40, 10) shows bearish momentum, but a change in market structure on the daily chart such as a break above a previous swing high would strengthen the bullish case. The Trend Strength Index (20, 10) is in overbought territory, signaling caution, but if the price fails to reverse soon, it could continue falling toward the 146 to 109 range, a historically strong support zone where price has rebounded multiple times. This area would become a key long term investment opportunity if reached.
Disclaimer: This content is for educational and informational purposes only. It does not represent financial advice or a recommendation to buy or sell any financial instrument. Trading involves risk, and you should only trade with money you can afford to lose.

TSLA theoryWe are ina bear market this year, But I'm optimistic long term.
This is a gem to accumulate, dca when is sideways.

TESLA Expected Growth! BUY!
My dear subscribers,
My technical analysis for TESLA is below:
The price is coiling around a solid key level - 239.33
Bias - Bullish
Technical Indicators: Pivot Points Low anticipates a potential price reversal.
Super trend shows a clear buy, giving a perfect indicators' convergence.
Goal - 257.40
About Used Indicators:
By the very nature of the supertrend indicator, it offers firm support and resistance levels for traders to enter and exit trades. Additionally, it also provides signals for setting stop losses
Disclosure: I am part of Trade Nation's Influencer program and receive a monthly fee for using their TradingView charts in my analysis.
———————————
WISH YOU ALL LUCK

Tesla Stock Drops 9%+ After Q1 Deliveries Drop to Three-Year LowTesla (Nasdaq: NASDAQ:TSLA ) is trading at $242.52 as of 1:04 PM EDT on April 4th, down 9.26%. The stock fell $24.76 after reporting weak Q1 2025 results. This came two days after Tesla closed its worst quarter since 2022, shedding 36% in market value. The company delivered 336,681 vehicles in Q1, missing analysts’ expectations of 360,000 to 377,590. This marked a 13% drop compared to Q1 2024, when it delivered 386,810 units. Production also fell to 362,615 vehicles from 433,371 in the prior year.
Tesla produced 345,454 units of its Model 3 and Model Y. Deliveries for those models stood at 323,800. Other models, including the Cybertruck, accounted for 12,881 deliveries. The quarter saw partial factory shutdowns to upgrade lines for a redesigned Model Y.
CEO Elon Musk said this model could again be the world’s best-selling car in 2025. But now the question is, will it?
Looking at it, Tesla faces several challenges, including increased EV competition and reputational damage tied to Musk’s political involvement. Of late, the CEO’s position in Trump’s Department of Government Efficiency (DOGE) has drawn backlash.
Protests, boycotts and vandalism against Tesla facilities and vehicles spread across the U.S and Europe. In Germany, Tesla’s EV market share dropped from 16% to 4%. Across 15 European countries, market share fell to 9.3% from 17.9%.
China also posed challenges. Tesla sold 78,828 EVs in March, an 11.5% year-on-year decline as domestic competitors like BYD increased their market presence. In Canada, Tesla claimed 8,653 EV sales during a January weekend to qualify for subsidies. The transportation ministry froze the payments and launched a probe into the claim.
Technical Analysis: Price Approaches Key Support Zone
Tesla’s price has declined sharply since hitting an all-time high of $488 in late December 2024. Since January, the stock has been in a downtrend, respecting a descending trendline. In early February, it broke a key support level at $290 and retested the level in late March before continuing downward.
Currently, the stock is approaching support at $190, a critical level for short-term price action. If it holds, the stock could attempt to break the descending trendline and move toward the $290 resistance.
If Tesla's bearish bias persists and breaks below $190, the next support sits at $140. This aligns with the head of a previously completed head-and-shoulder pattern. Breaking this level could trigger further losses.
The next few weeks will determine if it rebounds or slides deeper, with earnings report expected on Apr 22nd, 2025.

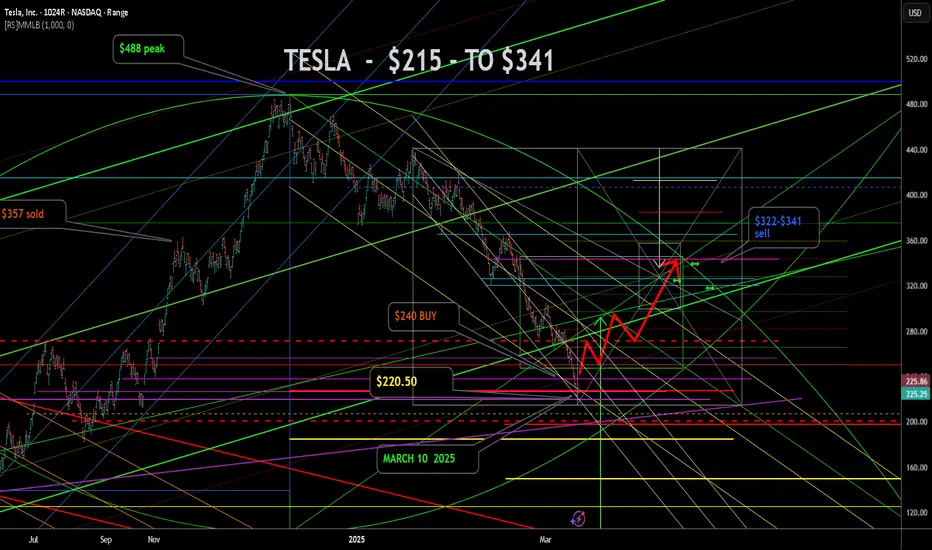
TSLA - BUY NOW - $240 I have been waiting for the low in Tesla . TSLA. Today is good enough at $240. Had to keep lowering the entry . Todays Legacy Media bad news bears were my trigger. You can always count of Corruption to help refine your technical signals. Murrey Math, Elliotwave, Kumar wave being used. Sell $340 for now. May $340 calls are a good way to play. Entertainment purposes only. Just having fun. Comments always welcome.

TESLA - THE CLIMB BACK TO $341 This is a pretty tough call to make right here. And I may get humbled. But the charts say to me - Kumar, there was a short term low today. And the next point of exhaustion is $341. Lets see what happens. This chart is likely a mess to most, but harmonious art work to me. Elliot, Murrey and Kumar being used for the analysis. Comments always welcome. Happy Trading.
TSLA - A false start? UPDATE : Tesla is unfortunately not starting on the right foot. The price action since the low is NOT impulsive to use an Elliot Wave term. So this is very unlikely to be the low. I will be selling my $265 calls near $255 price levels. And then patiently wait to see if we drift down for the true wave 5 down to $187. Additionally, the Murrey Frame 1/8ths line is also down there, as well a the Red dashed P line from the last break out. So..... if this take is wrong, and we manage to leave the channel gate move above $260 I will update. Until then its prayers to offload these longs profitably, and reset lower. Comments always welcome. And remember, trading is hard work, Sometimes we fish for a long time to catch the tastiest fish in the sea. Bona Fortuna!

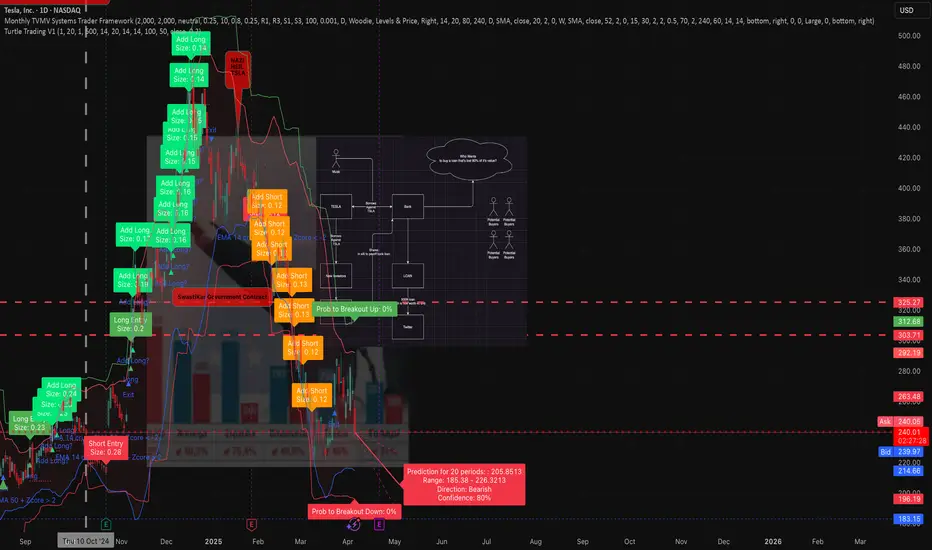
TSLA still bearish like I said. Why you should sue the board.This chart uses an unpublished modified turtle trader indicator / strategy combined with the unpublished TVMV framework using MFT candle sticks (published as separate indicator) and Bollinger bands. The max monthly position size is determined by seasonal probabilities, while the individual trade position sizes are determined by the turtle style volatility sizing based off the former's capital.
Nothing has changed about TSLA.
It has a work from home CEO who is who disconnected from reality and accountability that the stock will not recover. No amount of government contracts can over come the damage this man has done to the brand.
Sales and deliveries are down in every market and the car owners are afraid to drive their cars.
This recent pump had no basis. It lacked both fundamental value and technical value.
TSLA will break below 222 and may go as far as 109 by EOY if the board of directors does not fulfill their fiduciary obligations to share holder to remove Musk permanently .
Shareholders should seriously consider filing a class action law suit against the board of directors in collaboration with NY .
HOLY MOLY! ARE WE IN A RECESSION? $TSLA $120 BEAR FLAG PATTERNA bear flag trading pattern is a technical analysis formation that features a downward-sloping flagpole, followed by a consolidation phase forming a parallel channel. This pattern suggests a potential sharp decline or continuation of the downward trend
I also notice a head and shoulders pattern, as well as an inverse cup and handle.
Everything points to $120.
Sell/Short NASDAQ:TSLA right now with fact check:
+brand reputation risk, high competition, loss of EV market leadership, cyber truck/ product recalls, declining sales with lower margin, stock volatility concern, insider selling, investors buy it based on expected future earnings rather than its current profitability.
+ potential stagflation, tariff war, slow economic growth, inflation, rising public debt, geopolitical tensions, ai bubble, and more

Tesla Potential Long LurkingTesla has a very good chance of having a move up from here.
What indicates this?
1) RSI is low at the moment and creating bullish divergence on the 12h and Daily timeframes.
2) The weekly timeframe shows price is where it should be.
3) The 2 week timeframe indicates price should be slightly higher.
4) Because the weekly is telling is price is correct and the two week is saying price should be around 300 - 380. I would aim that in the next week of trading that price should go up.
I will update as soon as a long position is indicated. But for the time being indicators are pointing that a long is lurking. So keep an eye out on Tesla.
Stay Adaptable.

TSLA - Support Level 222 - 191NASDAQ:TSLA following downtrend heading towards its strong support level of 222. If fails to hold; Possibly hit 191

Pre market blows past TSLA supportPre market at 250 right now is just about pas support line, a Continuation of short til 220 at least is fully plausible. Just. bc its friday i wouldnt want to hold short til monday pre with how volatile the market movement is then. so be careful and prepared for a daily short position at least after seeing marker reaction and price movement confirmation. NASDAQ:TSLA

Honestly, I don't feel like explaining, the chart says it all !!Tesla's price can drop below $200 and then have a good increase.
Give me some energy !!
✨We spend hours finding potential opportunities and writing useful ideas, we would be happy if you support us.
Best regards CobraVanguard.💚
_ _ _ _ __ _ _ _ _ _ _ _ _ _ _ _ _ _ _ _ _ _ _ _ _ _ _ _ _ _ _ _
✅Thank you, and for more ideas, hit ❤️Like❤️ and 🌟Follow🌟!
⚠️Things can change...
The markets are always changing and even with all these signals, the market changes tend to be strong and fast!!

Weekly Bull FlagTesla have been in in downtrend for sometime it currently maybe started its 5th wave up if it successful breakout from this flag you can expect 280-320 in the coming weeks

Day Trade Review – TSLAThis video is a review of TSLA intraday price action based on a request. It examines how the stock could have been traded using a technical approach. The analysis covers the entire session from the open to the close, showing execution, trade management and decision-making without hindsight bias. It also includes additional insights on time and risk management trading intraday.
If you have any requests for future reviews, let me know.

Tesla shows downtrend As shown in the chart, there is a well-known pattern called Head and Shoulders. The black trendline represents the monthly data.

Tesla to bounce from hereNASDAQ:TSLA
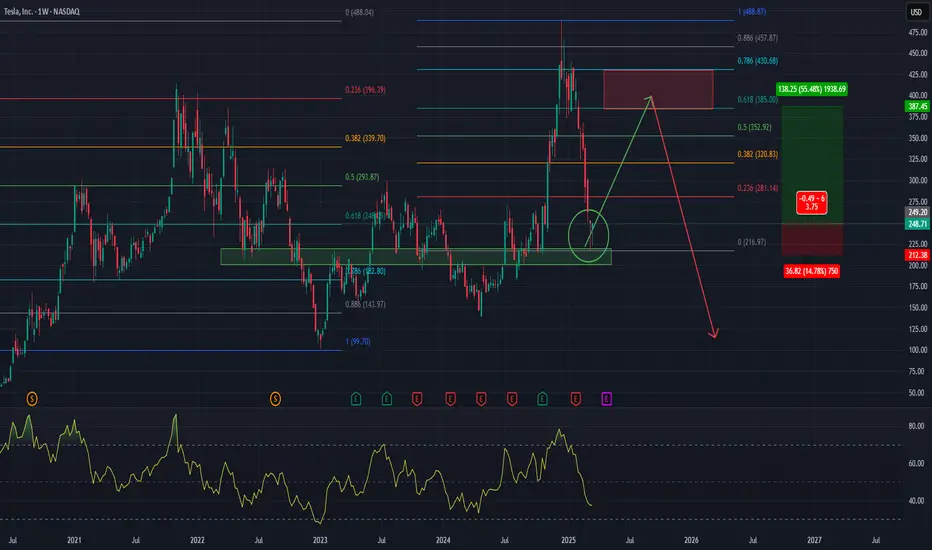
Tesla has reach and bonce from a key support level, as seen on the chart, in the Golden Pocket, between the 61.8% and the 78.6% Fibonacci Retracement, and it is shown two weekly hammer candlestick bar near each other, which is bullish. Odds that it has already found a mid-term bottom is high.
Now I expect a multi-week bounce from here, probably to the next Golden Pocket at the top, which is between $385 to $430 USD.
And yes, Elon Musk upset his customer base, and the stock is very expensive compared to other car manufacturers, and will probably see little to no growth in sales this year, or even a decline, insiders has sold big amounts of shares and it is all looking bad. And yes, we have probably already seen the top in Tesla in December last year for a long time.
However, stocks don’t generally go down in a straight line, the stock, as well as the stock market in general is oversold and do for a bounce, maybe a big bounce.
After the bounce, I will be looking for shorts, but now, I’m looking for longs.
Good luck to you
$100, $1,000, $100,000 — When Numbers Become Turning PointsHey! Have you ever wondered why 100 feels... special? 🤔
Round numbers are like hidden magnets in the market. 100. 500. 1,000. They feel complete. They stand out. They grab our attention and make us pause. In financial markets, these are the levels where price often slows down, stalls, or makes a surprising turn.
I’ll admit, once I confused the market with real life. I hoped a round number would cause a reversal in any situation. Like when I stepped on the scale and saw a clean 100 staring back at me, a level often known as strong resistance. I waited for a bounce, a sudden reversal... but nothing. The market reacts. My body? Not so much. 🤷♂️
The market reacts. But why? What makes these numbers so powerful? The answer lies in our minds, in market dynamics, and in our human tendency to crave simplicity.
-------------------------------------
Psychology: Why our brain loves round numbers
The human mind is designed to create structure. Round numbers are like lighthouses in the chaos — simple, memorable, and logical. If someone asks how much your sofa cost, you’re more likely to say "a grand" than "963.40 dollars." That’s normal. It’s your brain seeking clarity with minimal effort.
In financial markets, round numbers become key reference points. Traders, investors, even algorithms gravitate toward them. If enough people believe 100 is important, they start acting around that level — buying, selling, waiting. That belief becomes reality, whether it's rational or not. We anchor decisions to familiar numbers because they feel safe, clean, and "right."
Walmart (WMT) and the $100 mark
Round numbers also carry emotional weight. 100 feels like a milestone, a finish line. It’s not just a number, it’s both an ending and a beginning.
-------------------------------------
Round numbers in the market: Resistance and support
Round number as a resistance
Imagine a stock climbing steadily: 85, 92, 98... and then it hits 100. Suddenly, it stalls. Why? Investors who bought earlier see 100 as a "perfect" profit point. "A hundred bucks. Time to sell." Many pre-set sell orders are already waiting. Most people don’t place orders at $96.73. They aim for 100. A strong and symbolic.
At the same time, speculators and short sellers may step in, viewing 100 as too high. This creates pressure, slowing the rally or pushing the price back down.
If a stock begins its journey at, say, $35, the next key round levels for me are: 50, 100, 150, 200, 500, 1,000, 2,000, 5,000, 10,000…
Slide from my training materials
These levels have proven themselves again and again — often causing sideways movement or corrections. When I recently reviewed the entire S&P 500 list, for example $200 showed up consistently as a resistance point.
It’s pure psychology. Round numbers feel "high" — and it's often the perfect moment to lock in profits and reallocate capital. Bitcoin at $100,000. Netflix at $1,000. Tesla at $500. Walmart at $100. Palantir at $100. These are just a few recent examples.
Round number support: A lifeline for buyers
The same logic works in reverse. When price falls through 130, 115, 105... and lands near 100, buyers often step in. "100 looks like a good entry," they say. It feels like solid ground after a drop. We love comeback stories. Phoenix moments. Underdogs rising. Buy orders stack up and the price drop pauses.
Some examples:
Meta Platforms (META)
Amazon.com (AMZN) — $100 acted as resistance for years, then became support after a breakout
Tesla (TSLA)
-------------------------------------
Why round numbers work for both buyers and sellers
Buyers and the illusion of a bargain
If a stock falls from 137 to 110 and approaches 100, buyers feel like it’s hit bottom. Psychologically, 100 feels cheap and safe. Even if the company’s fundamentals haven’t changed, 100 just "feels right." It’s like seeing a price tag of $9.99 — our brain rounds it down and feels like we got an epic deal.
Sellers and the "perfect" exit
When a stock rises from 180 to 195 and nears 200, many sellers place orders right at 200. "That’s a nice round number, I’ll exit there." There’s emotional satisfaction. The gain feels cleaner, more meaningful, when it ends on a round note.
To be fair, I always suggest not waiting for an exact level like 200. If your stock moved through 145 > 165 > 185, don’t expect perfection. Leave room. A $190 target zone makes more sense. Often, greed kills profit before it can be realized. Don’t squeeze the lemon dry.
Example: My Tesla analysis on TradingView with a $500 target — TESLA: Money On Your Screen 2.0 | Lock in Fully…
Before & After: As you see there, the zone is important, not the exact number.
-------------------------------------
Round numbers in breakout trades
When price reaches a round number, the market often enters a kind of standoff. Buyers and sellers hesitate. The price moves sideways, say between 90 and 110. Psychologically, it’s a zone of indecision. The number is too important to ignore, but the direction isn’t clear until news or momentum pushes it.
When the direction is up and the market breaks above a key level, round numbers work brilliantly for breakout trades or strength-based entries.
Slide from my training materials
People are willing to pay more once they see the price break through a familiar barrier. FOMO kicks in. Those who sold earlier feel regret and jump back in. And just like that, momentum builds again — until the next round-number milestone.
Berkshire Hathaway (BRK.B) — every round number so far has caused mild corrections or sideways action. I’d think $500 won’t be any different.
-------------------------------------
Conclusion: Simplicity rules the market
Round numbers aren’t magic. They work because we, the people, make the market. We love simplicity, patterns, and emotional anchors. These price levels are where the market breathes, pauses, thinks, and decides. When you learn to recognize them, you gain an edge — not because the numbers do something, but because crowds do.
A round number alone is never a reason to act.
If a stock drops to 100, it doesn’t mean it’s time to buy. No single number works in isolation. You need a strategy — a set of supporting criteria that together increase the odds. Round numbers are powerful psychological levels, but the real advantage appears when they align with structure and signals.
Keep round numbers on your radar. They’re the market’s psychological mirror, and just like us, the market loves beautiful numbers.
If this article made you see price behavior differently, or gave you something to think about, feel free to share it.
🙌 So, that's it! A brief overview and hopefully, you found this informative. If this article made you see price behavior differently, or gave you something to think about, feel free to share it & leave a comment with your thoughts!
Before you leave - Like & Boost if you find this useful! 🚀
Trade smart,
Vaido

TSLA Sitting on the Edge: Gamma Pivot or Breakdown?
🧠 Macro View:
The Trump tariff shock sent waves across the market, particularly hitting growth and export-sensitive sectors. While NVDA and tech names dumped earlier, TSLA showed relative strength, bouncing near its high volume node — but this could change fast.
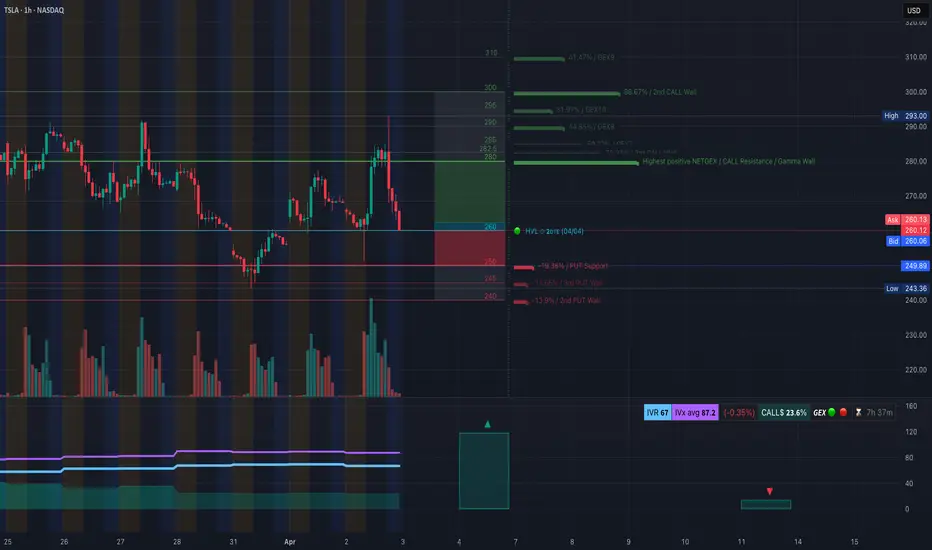
📊 Technical Analysis (1H Chart)
Structure:
* Price bounced from ~243 back toward 260, reclaiming key HVL.
* But it failed to break through the 265–285 supply zone (Gamma Wall zone).
* Now sitting on 260, a key equilibrium level.
Levels:
* Support:
* 🔹 260 (Current HVL zone)
* 🔹 250 – Gamma Put Support
* 🔹 243.36 (recent low, key for invalidation)
* Resistance:
* 🔺 280 → Call Resistance / GEX Wall
* 🔺 285–293 → Gamma ceiling, extremely difficult to break without institutional help
Indicators:
* Volume spiked on rejection from 280+, suggesting profit-taking or hedging.
* TSLA must hold above 260 to avoid slipping into a liquidity vacuum toward 250 or lower.
🔥 GEX + Options Sentiment
GEX Positioning:
* GEX: 🔴🟢 — mixed but leaning negative
* Call Walls:
* 280 = Gamma Wall + Call Resistance
* 285 = major rejection zone
* Put Walls:
* 250 = key dealer support
* 245 & 240 = deeper magnets if panic resumes
Options Oscillator:
* IVR 67 → High implied volatility rank, meaning traders are buying premium.
* IVx avg 87.2 vs current IVx (-0.35%) → indicates elevated fear is still embedded.
* Call$ 23.6% → neutral-to-bearish skew (not heavily bullish)
🧭 Trade Setups
🐻 Bearish Breakdown:
* Entry: Breakdown below 260 + confirmation with volume.
* Target: 250 → 243 (Put wall & previous swing low)
* Stop: 266+
* Catalyst: Further macro deterioration (tariff escalation, weak futures)
🐂 Bullish Bounce:
* Entry: Bounce from 260 with reclaim of 265.
* Target: 280 → 285 test (but high risk)
* Stop: Close below 258
* Watch: Strength in QQQ or SPY supporting the move
📌 Final Thoughts:
TSLA is at a tipping point. The Gamma wall at 280 caps upside unless we see an unwinding of fear. Dealers are likely short gamma below 260, and if 260 cracks, their hedging will accelerate the downside to 250–243.
This is a reaction zone, not a trend zone** — trade lightly and watch for traps.
⚔️ Trade Idea:
Buy 250P (1–2 week expiry) on breakdown below 260
Alt: Scalper can try 260C if market shows strong bounce and reclaim 265 with volume
Neutral bias till clear break of 260 or reclaim of 265+
This analysis is for educational purposes only and does not constitute financial advice. Always do your own research and manage your risk.
the downtrend is broken!boost and follow for more! ❤️🔥 Tesla is finally breaking its downtrend it entered at the start of the year, it also had a bullish resistance = support bounce after the initial breakout!
I think we may rally to my 300-336-376 short term term targets from here 🎯

Do you think Tesla will reach back up to all time highs?Do you believe Tesla can make its way back up after this sharp decline? or do you think there is still more downside to come?

Tesla Bull Trap is copiumThere is currently 0% probably of a substantial breakouts in either direction.
Tesla is crabbing and will likely continue to crab with high volatility until May.
Nothing about the fundamentals has changed, and no technicals in terms of trend, volume, momentum, volatility and options chains suggests a reversal is nessary.
The overall damage Elon has done to the brand is likely irreversible at this point. Sales in Germany are down I believe 90%, and more than 50% in the US, meanwhile in China BYD is dominating. Moreover, China or Germany could seize the gigafactory in retaliation for tarrifs if they wanted. That only leaves Texas and Nevada as manufacturing hubs on products without any sales.
The promise of a fleet is a pipedream because FSD is not safe. Though this regime may push it through for Elon's benefit, it would only serve to incr3ase liabilities on their balance sheet and further damage the brand so it's not the moon shot he presents it to be.
The entire brand was built on climate pledges and hope.
The CEO has now endorsed big oil, he's running massive gas generators for AI, supports the regime that backed out of the Paris Agreement (again) and the protests are growing in momentum without any sign of slow down.
In short TSLA is in the "find out" phase.
