TSLA — Holding Momentum at Critical Levels. Aug. 11TSLA — Holding Momentum at Critical Levels: Can Bulls Push Through? 🚀
Technical Analysis (1H Chart)
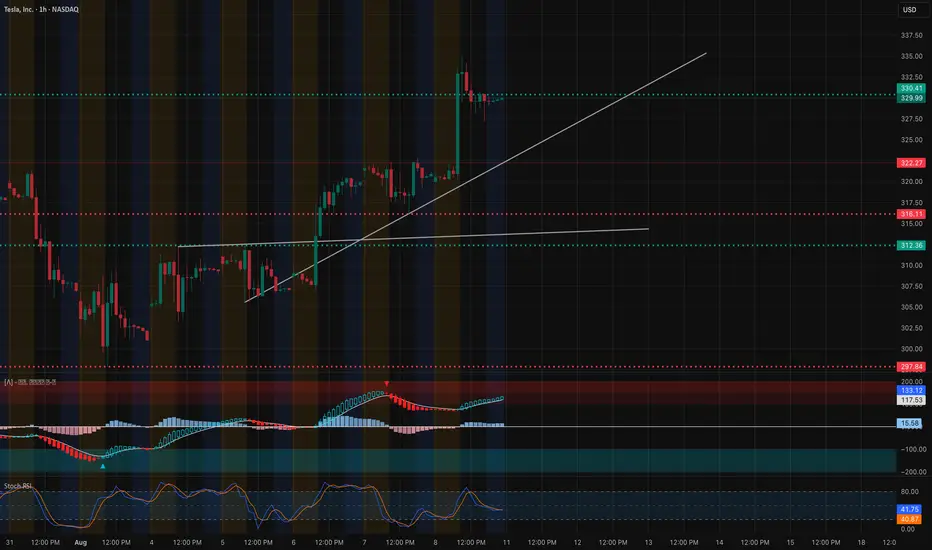
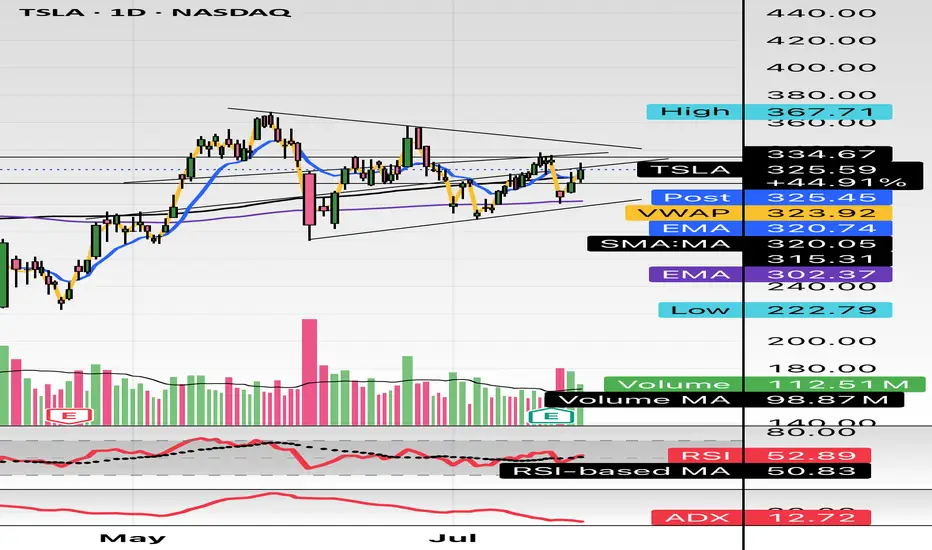
TSLA has maintained a steady uptrend, respecting the rising trendline support from early August. The recent breakout above 325 pushed price into the 330–335 resistance zone, which aligns with a prior supply level and the high from earlier this month. Momentum indicators are still favoring bulls — MACD histogram remains positive and Stoch RSI is curling up from mid-range, hinting at potential continuation if price sustains above 330.41.
Immediate support is at 325 trendline confluence; a breakdown here could lead to a retest of 322.27 and deeper support at 316.11. Holding above 330 keeps the bullish bias intact with room toward 337–340 as the next technical target.
GEX / Options Sentiment
* Key Resistance (Calls / Gamma Walls):
* 335.00 → Highest positive NetGEX & major call wall resistance.
* 345.00 → GEX7 (47.48%), secondary upside barrier.
* 370.00 → GEX10 extreme bullish zone, unlikely without strong catalyst.
* Support (Puts / HVL Zones):
* 321.28 → HVL & strong support cluster.
* 310.00 → First PUT wall; loss here would open downside toward 300.
* 300.00 → Major PUT support (-16.97%), key bear target if breakdown occurs.
* Sentiment: Calls outweigh puts at 48.8%, IVR is low at 4.7 (cheap options), suggesting directional plays could be favored over premium selling.
Trade Thoughts:
* Bullish Scenario: Hold above 330.41 → Targets 335 then 345. Use 325 trendline as stop guide.
* Bearish Scenario: Break below 325 trendline → Targets 322.27 and 316.11, with possible extension toward 310.
* Options Angle: Low IVR supports debit strategies (buying calls/verticals) for bullish bias. Put spreads may work if breakdown starts below 325 with momentum confirmation.
Disclaimer: This analysis is for educational purposes only and does not constitute financial advice. Always do your own research and manage risk accordingly.
TSLA trade ideas
TSLA - Larg Cap Gappers State 1 – In-depth Analysis of the Metric Table (TSLA)
Symbol: TSLA – Tesla, Inc.
Exchange: NASDAQ
Index Affiliation: Component of NASDAQ-100 (NDX) and S&P 500; highly liquid, large-cap with global market influence.---
1. Role of the Metric Table
The Metric Table compiles TSLA’s market stats, momentum conditions, volatility profile, and breakout readiness into one quick-reference tool. It enables traders to:
Confirm whether current price action supports momentum trading or requires patience.
Evaluate upside potential and downside protection zones.
Align entries with multi-timeframe trend structure.---
2. Key Data Group Insights
A. Core Stock Data
Auto Cap: Big Cap.
Market Cap: $879.48B – heavyweight market influence.
Volume: 92.1M – very high liquidity.
Public Float: 2.712B shares – large, requiring strong catalysts for outsized moves.
Leverage Multiplier: 0.03 – low natural leverage.
B. Momentum & Price Action
Pump % / Price Δ: +13.36% / +22.99% in recent rallies.
Prev Close / Now: $322.77 / $330.11 – current bullish bias.
Explosive Ratio (10d): 0.12 – moderate short-term move potential.
Natural Leverage (Now): 0.11 – stable for a large cap.
C. Technical Signals
Momentum Signal: Moderate Momentum – trending upward but not yet at breakout acceleration.
Beta Signal: Low Volatility – relatively stable compared to high-beta stocks.
Price Range Signal: Low Volatility – consolidation setting up for next move.
D. Risk Control Metrics
Estimated Stop Loss: $307 (H4) / $305 (1D).
Breakout Ready: L3 – nearing breakout alignment.
Trend Trigger: Levels in sequence for continuation if resistance is cleared.
E. Overall Status
Bull Momentum: YES.
Overall Signal: Excellent (Very Bullish).
Market Phase: Sideways consolidation within broader uptrend.---
State 2 – Risk Management & Trade Structure (TSLA)
Trading Style: Swing breakout strategy, large-cap momentum.
Share Size Scenario: Adjustable based on account size; risk per share determined by SL placement.---
1. Key Entry & Risk Zone
Setup Trigger Zone: $319 – optimal entry on pullback confirmation.
Capital Defense Line: $307 – hard stop for swing positions.
Smart Trailing Guard: $296 – deeper volatility cushion for longer holds.---
2. Breakout Targets
TP1 – Momentum Hold: $342 – first upside checkpoint.
TP2 – Intensity Zone: $353 – major resistance test.
TP3 – Breakout Shift Zone: $365 – aggressive swing target.
Max Exhaustion Limit: $391 – extended run potential on strong momentum.---
3. Trailing Stop Strategy
Entry at $319–$322:
After TP1 → move SL to breakeven.
After TP2 → secure 50% gains, trail remainder under prior 2–3 H1 lows.
If momentum continues into TP3/Max → tighten trailing to 15-min chart for profit lock.---
4. Timeframe Plan
Risk Direction: 4H chart for swing bias.
Entry Confirmation: 10-sec close rule on breakout/pullback candles.
Exit:
Short-term profit lock → 15-min chart.
Extended move → 1H trailing.---
5. Position Management
Size positions so that risk from entry to SL = 1–2% of account equity.
Take partial profits at TP1 & TP2 to secure gains and reduce exposure before major resistance zones.---
Disclaimer
ALGTP Watchlist is for educational purposes only, demonstrating trade setups and risk plans using ALGTP Indicators.
Members must have trading experience and know how to apply ALGTP Indicators.
Without ALGTP tools, traders must self-manage risk.
Not a buy/sell recommendation.

TSLA Golden Zone Test: Cup & Handle Breakout Ahead?📊 Market Breakdown
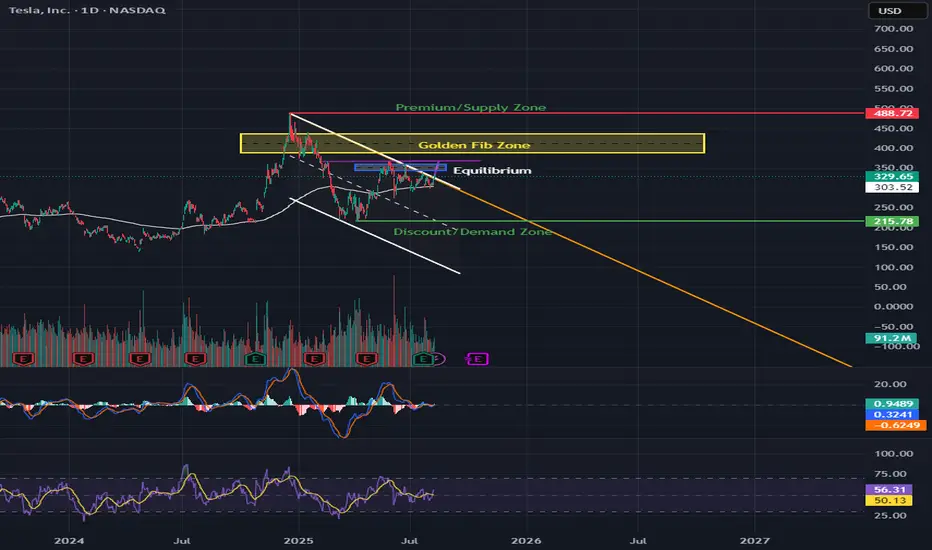
TSLA is trading at $329.65 and is caught between major zones — the Golden Fib Zone ($365–$385) above and the Equilibrium ($294) below.
Trend: Price recently broke out of a descending trendline but is still inside a bigger channel.
Pattern Watch: There’s a potential cup & handle forming. If confirmed, this could be the fuel that launches us toward the $365–$385 resistance area.
Momentum: MACD is flattening near zero (possible bullish crossover brewing), and RSI at 56 gives us room to push higher before overbought territory.
🛒 CALLS (Bullish Scenario)
Buy Zones:
🎯 Aggressive Entry: Bounce from $320–$325 support
✅ Confirmation Entry: Daily close above $340 with strong volume
Take Profits:
1️⃣ $365 – First target at the start of Golden Fib Zone
2️⃣ $385 – Fib Zone top and key resistance
3️⃣ $488 – Long-term premium/supply zone
Stop-Loss: $315 (just below recent support)
Why This Works: A breakout above $340 also breaks the handle of the cup, unlocking room to run toward $365+.
🛑 PUTS (Bearish Scenario)
Sell Zones:
🚨 Rejects $340 resistance with heavy selling
📉 Breakdown and daily close under $315
Take Profits:
1️⃣ $294 – Equilibrium
2️⃣ $250 – Key psychological level
3️⃣ $215–$220 – Discount/Demand Zone
Stop-Loss: $330 (above rejection point)
Why This Works: A failed breakout with a close under $315 breaks short-term bullish structure, opening the door for a drop back toward $294 equilibrium.
🔍 Technical Highlights
Cup & Handle Potential: Neckline around $340; break = bullish continuation.
EMA 200 ($219.82): Still far below, showing this is more of a swing/mid-term momentum play.
Volume: Recent spikes suggest institutions are active at these levels.
Macro Watch: TSLA moves with tech sentiment; keep an eye on NASDAQ trend.
⏳ Option Expiration Strategy:
1 Week: For quick bounce or rejection plays at $340
2 Weeks: Breakout targeting $365
3 Weeks: Full push toward $385–$488 supply zone
Trading TSLA1:39 am 8/8/25Bullish Entry: 324.00 / 328.00 Bullish Stop 330.00 Bullish Target 330.00
Bearish Entry: 318.00 / 316.00 Bearish Stop 321.50 Bearish Target 312.00.....................Note: Supply zone 335.50/338.00

TSLA pivot points suggesting imminent breakoutTSLA is in a tightening pattern, which can of course break either bullish or bearish. given the overall trend and market conditions, I have a bullish lean on it. After doing some pivot point analysis this evening I have shifted the bull break odds even higher in my mind, and not only that, I believe the bull break may be imminent this week.

TSLA: 321.20Bullish Entries: 322.00 / 323.00 (high activity) Target:
328.00 / 330.00 Stop:
319.00 TSLA needs to close the earning gap at 332.69. Its continuation price of 332.00/336.00 is within the supply zone. Be very careful.

TSL PatienceTSL Fractal. Another several months of accumulation until December 2027 Chop then Parabolic. Chop Chop Chop. Dollar Raising Risk Off. Bitcoin Topping. Dollar Bottoming.

SLA Moderate Bullish Setup – Weekly Play for 08/01 Expiry
## ⚡ TSLA Moderate Bullish Setup – Weekly Play for 08/01 Expiry
🎯 *"Volume confirms it. RSI supports it. Time to strike—or stand by."*
---
### 🔍 Market Intelligence Snapshot:
📊 **Consensus**: Moderately Bullish
📈 **Weekly RSI**: Rising
📉 **Daily RSI**: Still Neutral (momentum building)
📉 **VIX**: Low → Great environment for call buying
📦 **Volume**: Strong institutional activity across models
---
### ✅ Recommended Trade Setup:
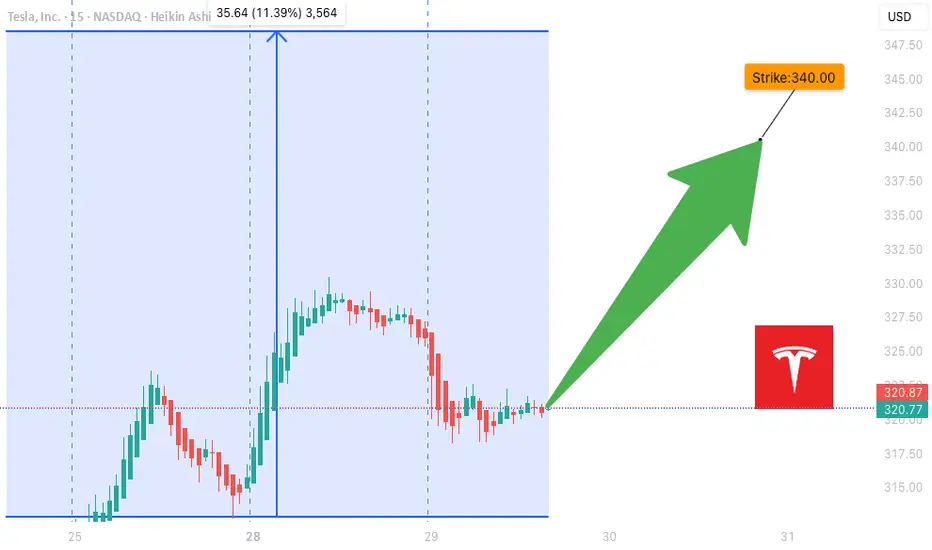
**TSLA \$340 CALL (Exp: Aug 1)**
💰 *Entry*: \~\$0.88
📈 *Target*: \$1.38
🛑 *Stop*: \$0.35
📆 *DTE*: 3 Days
🎯 *Entry*: Market Open
⚖️ *Confidence*: 65%
---
### 🔧 Model Blended Strategy Notes:
* Meta & Anthropic: Suggest ATM/ITM (\$327.50–\$330) → safer, higher cost
* Google & xAI: Prefer \$340–\$342.50 for a better risk/reward
* DeepSeek: Targets \$320 but with heavier premium
🧠 *Takeaway*: \$340 offers a balanced shot — affordable, but still responsive to upside flow.
---
### ⚠️ Risk Notes:
* ⏳ Time Decay → Quick exits = better outcomes
* 📰 External news or earnings reactions = watch for sudden volatility
* 🎯 Position size = keep light due to only 3 DTE
---
### 📊 TRADE SNAPSHOT (JSON):
```json
{
"instrument": "TSLA",
"direction": "call",
"strike": 340.0,
"expiry": "2025-08-01",
"confidence": 0.65,
"profit_target": 1.38,
"stop_loss": 0.35,
"size": 1,
"entry_price": 0.88,
"entry_timing": "open",
"signal_publish_time": "2025-07-29 10:16:14 UTC-04:00"
}
```
---
### 🧠 Quick Captions for Social:
* “TSLA bulls waking up? \$340C looks lit for the week 📈🔥”
* “Call volume surging. RSI rising. Low VIX. This \ NASDAQ:TSLA 340C might run 💥”
* “Risk-managed breakout shot — in and out fast 🎯”
$TSLA either one big flag or massive short setting upHello,
Just some browsing, NASDAQ:TSLA hasn’t had any major moves prior to early May - June IMO. This is on my watch for a short swing setup. This is bull flagging but I see a short here. I’m conflicted. I do see the higher low but we are in a pitchfork and this has been consolidating in this $290-$340 area for about a month and half. There’s also a lower high. Just posting for some free dialogue and open ideas. Talk to me. Let me know what you see and think. We aren’t too far from 200EMA and 200SMA. It’s just curling above the 50 as well. Maybe we consolidate for another week or two? A massive move is brewing here I think. I’m talking $100 in a week up or down soon.
WSL
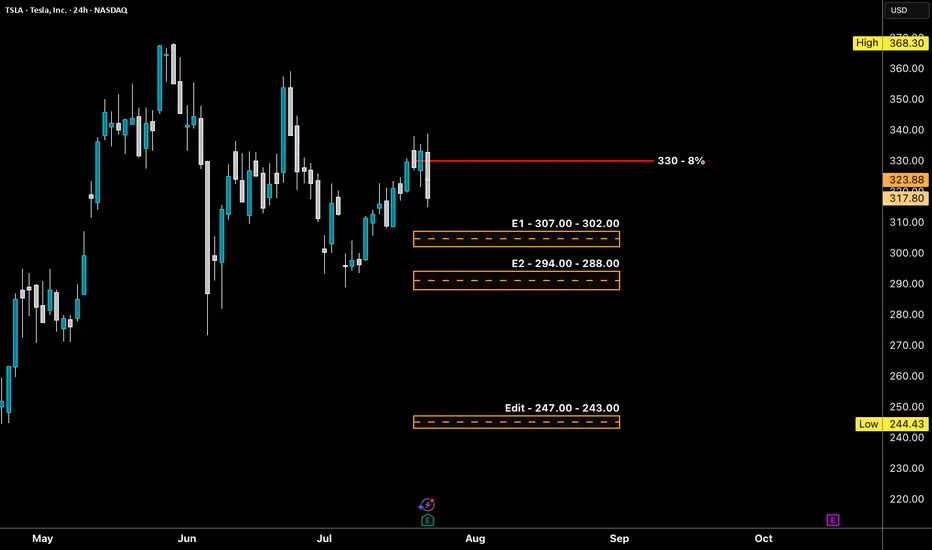
TSLA - LONG Swing Entry Plan NASDAQ:META - LONG Swing Entry Plan
Entry Zone 1: $307.00 – $302.00
→ Open initial position targeting +8% from entry level.
Entry Zone 2: $294.00 – $288.00
→ If price dips further, average down with a second equal-sized entry.
→ New target becomes +8% from the average of Entry 1 and Entry 2.
Edit Zone (Aggressive Demand): $247.00 – $243.00
→ If reached, enter with double the initial size to lower the overall cost basis.
→ Profit target remains +8% from the new average across all three entries.
Risk Management:
Stop Loss:
Risk is capped at 12% below the average entry price (calculated across all executed positions including the Edit Zone).
Position Sizing Approach:
Entry 1: 1x
Entry 2: 1x
Edit Zone: 2x
→ Total exposure: 4x
→ Weighted average determines final TP and SL calculations.
______________________________________
Legal Disclaimer
The information provided in this content is intended for educational and informational purposes only and does not constitute financial, investment, or legal advice or recommendations of any kind. The provider of this content assumes no legal or financial responsibility for any investment decisions made based on this information. Users are strongly advised to conduct their own due diligence and consult with licensed financial advisors before making any financial or investment decisions.
Sharia Compliance Disclaimer: The provider makes no guarantees that the stocks or financial instruments mentioned herein comply with Islamic (Sharia) principles. It is the user’s responsibility to verify Sharia compliance, and consultation with a qualified Sharia advisor is strongly recommended before making any investment decisions
TSLA WEEKLY OPTIONS SETUP
### 🚗 TSLA WEEKLY OPTIONS SETUP (2025-07-28)
**Big Call Flow. Low VIX. Can Bulls Hold \$325?**
---
📊 **Momentum Overview:**
* **Daily RSI:** 48.2 🔻 → *Neutral-to-Weak*
* **Weekly RSI:** 57.1 🔻 → *Still bullish zone, but falling*
⚠️ **Interpretation:** Momentum is softening, trend in question.
📉 **Volume Context:**
* **Volume Ratio:** 1.3x ⬆️ (vs. last week)
* **Price Change:** -0.77% despite that volume
🔍 *Distribution Alert:* Institutions may be selling into strength.
📈 **Options Flow:**
* **Call/Put Ratio:** **1.70** = 🚨 *Bullish flow confirmed*
* **Volatility (VIX):** 15.16 🟢 Favorable for directional plays
✅ Strong setup for options traders riding short-term momentum
---
### 🧠 **Weekly Sentiment Scorecard:**
* ✅ **Bullish Signals (2):** Options Flow, Volatility
* ⚠️ **Neutral Signals (2):** Daily & Weekly RSI
* ❌ **Bearish Signal (1):** Volume pattern = distribution risk
**Overall Bias:** 🟢 *Moderate Bullish*
---
### 🔥 **TRADE SETUP IDEA:**
🎯 **Strategy:** Long Call Option
* 📌 **Instrument:** TSLA
* 💵 **Strike:** \$355C
* 📅 **Expiry:** Aug 1, 2025
* 💸 **Entry:** \~\$0.75
* 🎯 **Profit Target:** \$1.50
* 🛑 **Stop Loss:** \$0.45
* 🔒 **Key Support to Watch:** \$327.50 — lose that = exit fast
📈 **Confidence Level:** 65%
⚠️ **Gamma Risk:** High → trade small, manage tight.
---
### 📦 TRADE\_DETAILS (JSON Format for Algo/Backtest):
```json
{
"instrument": "TSLA",
"direction": "call",
"strike": 355.0,
"expiry": "2025-08-01",
"confidence": 0.65,
"profit_target": 1.50,
"stop_loss": 0.45,
"size": 1,
"entry_price": 0.75,
"entry_timing": "open",
"signal_publish_time": "2025-08-01 09:30:00 UTC-04:00"
}
```
---
### 🧭 **Quick Notes for Traders:**
* ✅ Bulls have short-term edge — but **momentum is fading**
* ⚠️ If TSLA breaks below **\$325**, exit fast.
* 🔍 Watch for fakeouts: options flow is bullish, but volume says “not so fast.”
---
📊 TSLA \$355C → Risk \$0.75 to potentially double 📈
💬 Will this hold, or is it a bull trap before a dump? 👀
Comment below ⬇️ and follow for Monday updates!
---
**#TSLA #OptionsFlow #WeeklyTrade #TradingSetup #GammaRisk #AITrading #TeslaStock #UnusualOptionsActivity #SmartMoneyMoves**

$TSLA: Breakout Wave Dimensions🏛️ Research Notes
Apart from known compression patterns for Tesla, there is another squeeze happening on smaller scale:
That area will be processed to derive the chart-based levels and see how market reacts to them.
Triangle
Breakout Expansion

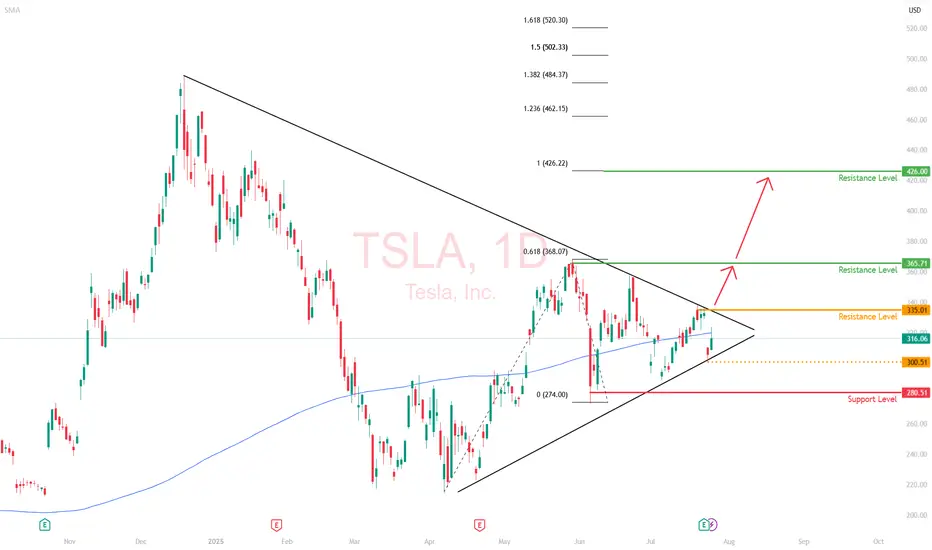
Tesla Stock in Bearish Trend - Further Downside ExpectedTesla Stock in Bearish Trend - Further Downside Expected
Tesla's (TSLA) stock price continues to display a clear bearish trend structure, characterized by the formation of consistent lower lows and lower highs on the price chart. This technical pattern suggests sustained selling pressure and indicates the downtrend will likely persist in upcoming trading sessions.
Key Technical Observations:
- Established Downtrend: The consecutive lower highs and lows confirm the bearish price structure remains intact
- Weak Momentum: Each rally attempt has failed to gain traction, meeting selling pressure at progressively lower levels
- Critical Price Levels: The stock has established well-defined resistance and support zones for traders to monitor
Price Projections:
- Downside Target at $272: The bearish momentum could drive TSLA toward the $272 support level, representing a potential 15% decline from current levels
- Key Resistance at $370: Any recovery attempts will likely face strong selling pressure near the $370 level, which now serves as a major resistance barrier
Market Implications:
1. Bearish Continuation Expected: The prevailing trend structure favors further downside unless a significant reversal pattern emerges
2. Breakdown Risk: A decisive move below current support levels could accelerate selling momentum toward $272
3. Short-Term Rally Potential: While the overall trend remains down, temporary rebounds toward $370 may present selling opportunities
Trading Considerations:
- Short Positions: Consider maintaining bearish exposure while price remains below the $370 resistance level
- Stop Loss: A sustained break above $370 would invalidate the immediate bearish outlook
- Profit Targets: $272 serves as the primary downside objective, with potential support levels to watch along the way
Risk Factors to Monitor:
- Market sentiment shifts in the EV sector
- Changes in Tesla's production/delivery outlook
- Broader market conditions affecting tech/growth stocks
The technical setup suggests Tesla shares remain vulnerable to further declines, with $272 emerging as the next significant downside target. Traders should watch for either confirmation of the bearish continuation or potential reversal signals near key support levels. As always, proper risk management remains essential when trading in trending markets.

A Strategic Long Opportunity Amid VolatilityCurrent Price: $316.06
Direction: LONG
Targets:
- T1 = $324.00
- T2 = $328.50
Stop Levels:
- S1 = $312.50
- S2 = $308.00
**Wisdom of Professional Traders:**
This analysis synthesizes insights from thousands of professional traders and market experts, leveraging collective intelligence to identify high-probability trade setups. The wisdom of crowds principle suggests that aggregated market perspectives from experienced professionals often outperform individual forecasts, reducing cognitive biases and highlighting consensus opportunities in Tesla.
**Key Insights:**
Tesla’s stock presents both short-term risks and long-term upside opportunities. Despite recent earnings misses and margin compression, its pivot into AI and robotics offers significant growth opportunities. Upside resistance zones near $325-$330 create favorable price targets, while support levels at $307-$310 suggest strong buying interest. This environment could favor a long trading strategy, provided disciplined risk management is maintained.
**Recent Performance:**
Tesla recently experienced notable sell-offs following disappointing earnings, attributed to compressed margins and weaker EV demand. However, the stock rebounded 3.5% from last week’s lows, signaling resilience amid uncertainty. Year-to-date, Tesla remains one of the top-performing stocks with a 54% price increase, reflecting strong underlying investor confidence in its long-term story.
**Expert Analysis:**
Market experts are divided on Tesla’s trajectory. Near-term fundamentals appear challenging with declining revenue (-12% YoY) and price cuts impacting profitability. However, bullish projections from analysts such as Kathy Wood highlight Tesla’s potential for disruptive innovation in AI and robotics. Its ambitious initiatives like robo-taxi deployment add speculative appeal but also introduce scaling and regulatory risks.
**News Impact:**
Tesla’s upcoming robo-taxi launch in San Francisco is poised to impact market sentiment significantly. While safety drivers will be required during the initial rollout, scalability and regulatory challenges could limit the project’s immediate impact. Meanwhile, recent disappointing earnings results may weigh on sentiment in the short term while providing an opportunity for potential retrishments off support levels.
**Trading Recommendation:**
Given the current setup, Tesla appears poised for long-term growth, with upside resistance levels suggesting a viable rally opportunity. Investors should consider taking a bullish position while maintaining stops near key support zones to mitigate downside risks. This balanced approach aligns well with Tesla’s speculative appeal and broader investor sentiment.

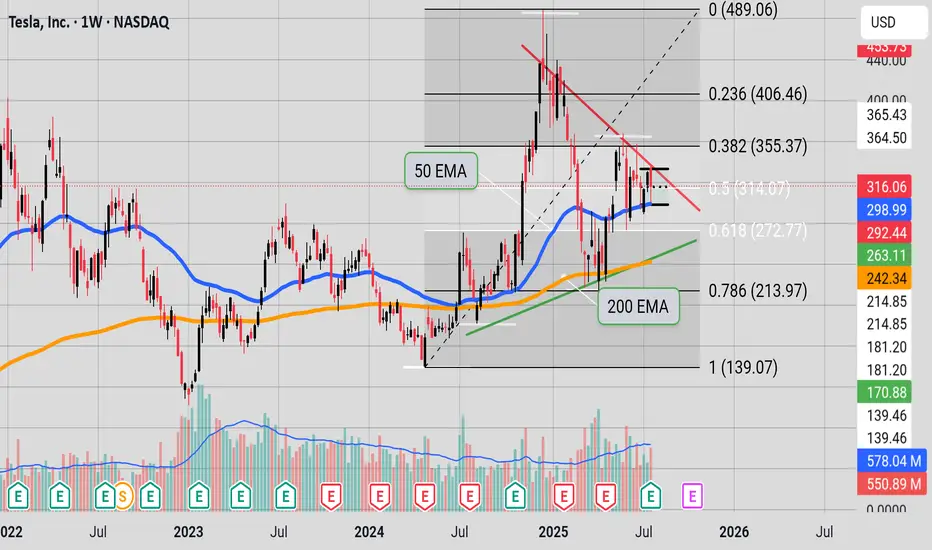
Unpack the Range, How to buy TeslaHello, I’m The Cafe Trader.
As part of our MAG 7 series, I’m going to show you how to find good pricing on TSLA for your long-term portfolio.
There’s a lot of hype surrounding Tesla right now — and for good reason. From a long-term investment standpoint, the future looks promising. But we still want to enter at the right price.
In my previous article, I gave TSLA a strong buy at $210–$220, and there were multiple opportunities in that range. But that was a few months ago. Let’s take a look at what the charts are telling us today.
⸻
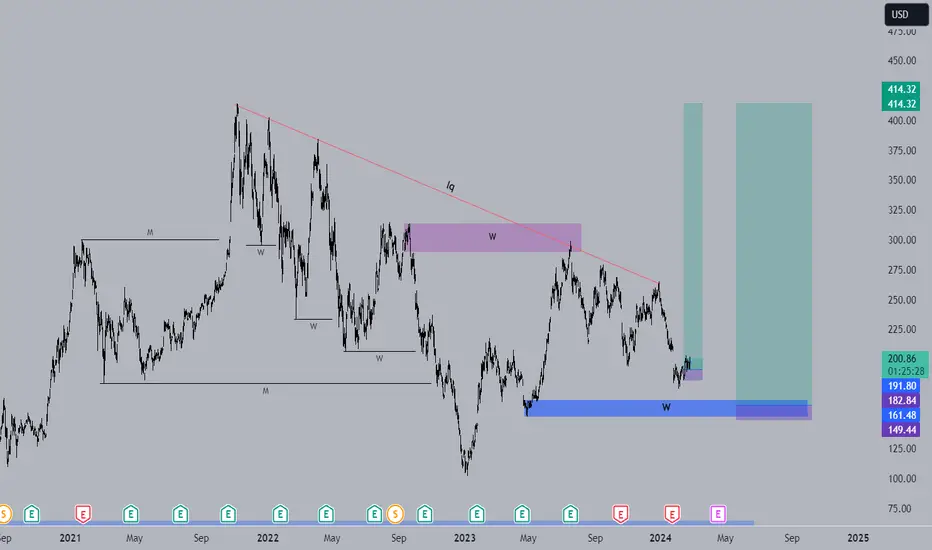
🔲 In the Middle of a Big Range
With a range from $212 to $488, Tesla offers plenty of opportunity for traders — but for investors, it can stir up anxiety.
If you’re holding shares around $330+ and considering selling just to break even, here are three reasons you may want to reconsider:
⸻
1. 🚀 Future Prospects
Tesla is packed with upcoming catalysts:
• Grok AI release
• The highly anticipated Model Q
• Megapack energy storage scaling on an industrial level
These innovations, along with strong brand momentum, could drive the stock 2x, 3x, even 5x over the next few years.
⸻
2. 📈 Trending Up
While some may argue we’re forming a double top, a deeper look at the weekly or monthly chart shows no real signs of weakness. If you’re investing — not just trading — you need that longer-term perspective.
Tesla remains in an uptrend with healthy structure and plenty of strength in the larger timeframes.
⸻
3. 🛡️ Learn to Hedge Your Position
Even if we see 20–30% downside from supply zones, there are ways to protect yourself.
Hedging with options — such as buying puts — can reduce downside risk without selling your shares. If done correctly, you can turn a large drawdown into a smaller loss or even a profit on the hedge.
⚠️ Only do this if you understand how options pricing and time decay work.
⸻
🧠 Passive vs. Aggressive Sellers
Today (July 21st), TSLA tapped into a supply zone and rejected quickly — a sign that sellers are still active around $330, while buyers lack confidence to push through.
🔹 Passive Selling
These are quiet, standing orders — often from large sellers who don’t want to move the market. They sell gradually to avoid spooking buyers.
🔹 Aggressive Selling
This is intentional unloading — where sellers push to exit their position quickly, even at the cost of driving the stock down.
What we saw today looked like passive selling — I’ll cover this in more detail in my short-term TSLA article.
⸻
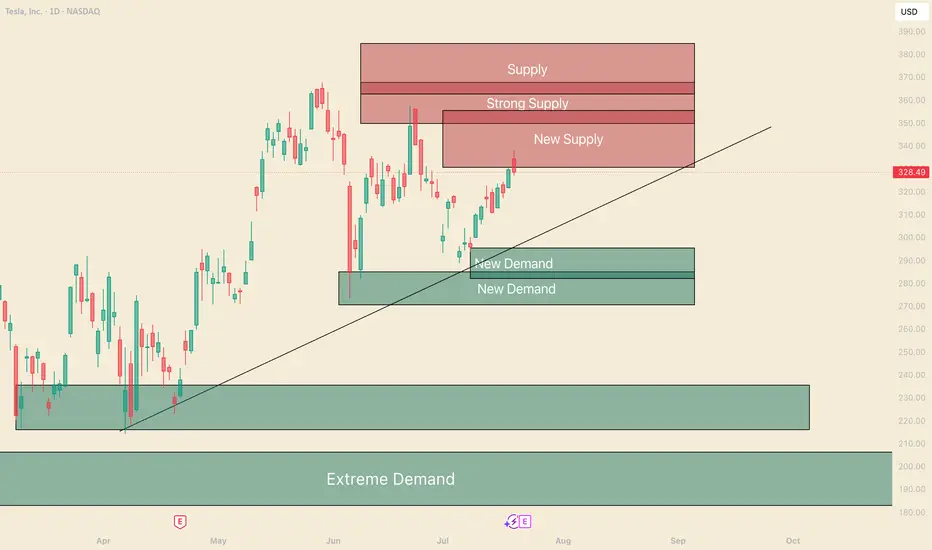
📊 My Buy Zones for TSLA
Fair Price: $296–$310
• $296 is the top of recent buying liquidity
• $310 is the bottom of the current uptrend
• This is where aggressive buyers may show up if sellers ease off
Good Price: $270–$284
• $284 is a strong support level where reinforced buyers have stepped in
• This has been a hot zone and a likely area for long entries to return
Steal Price: $220–$235
• Not marked on the chart, but this zone is high-demand territory
• Even with bad press or short-term issues, this would be a great long-term value buy
⸻
That's All for TSLA Long Term. Follow and stay tuned for a short term analysis.
@thecafetrader
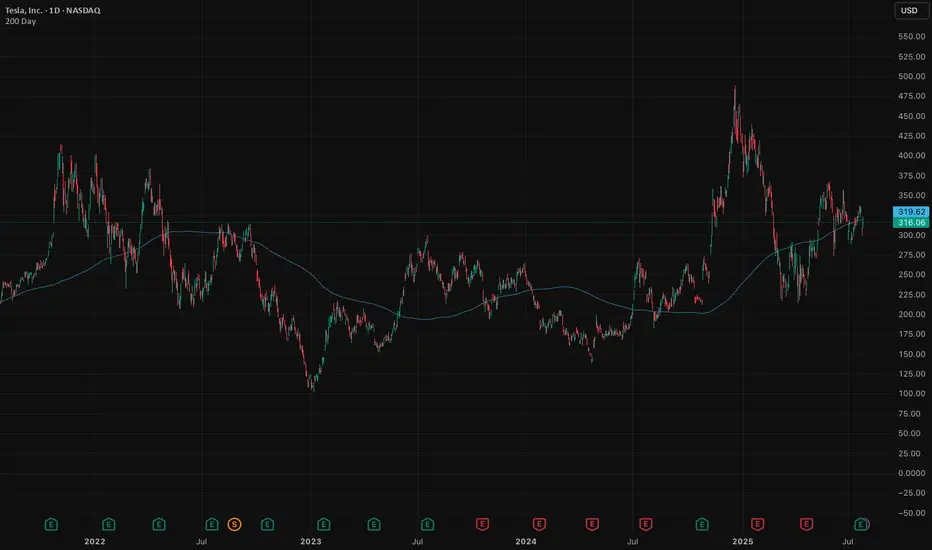
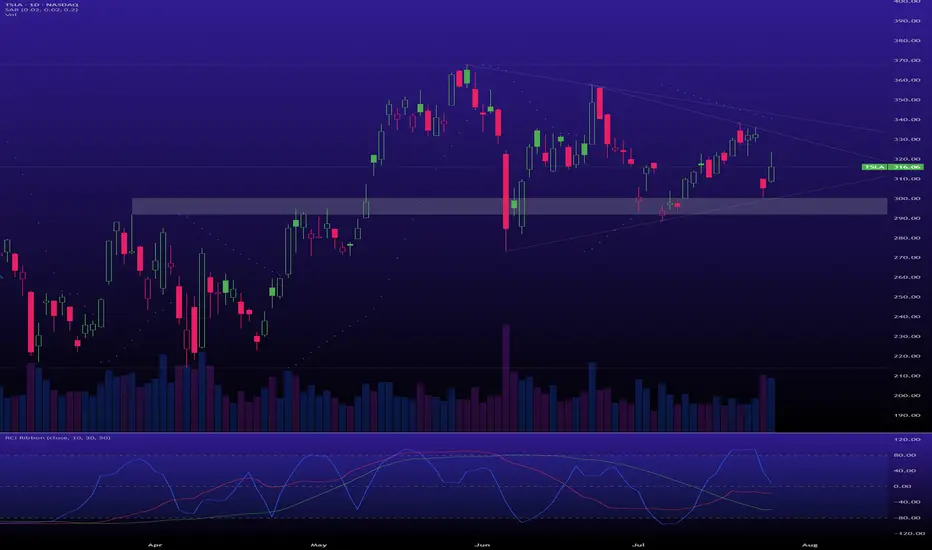
Tesla (TSLA) | Short-Term Compression, Long-Term ExTesla’s daily chart is coiled, with price currently trading at $316, sitting along the 200-day moving average. This looks like a consolidation phase with significant moves building up.
Price Action Snapshot
TSLA sold off last week, rejecting the $335 resistance level before finding footing around $300. The previous range of $280 and $365 is now tightening.
Immediate resistance sits at $335 with a clean breakout above that zone likely triggering momentum back toward the upper range of $365.
The recent drop does not seem like a capitulation move; it's likely institutional redistribution. Smart money is repositioning, not exiting.
Market Is Focused on the Wrong Data
Tesla’s Q2 earnings were objectively weak. Revenue fell 12%, deliveries dropped, and operating margins got clipped.
But this correction isn't all about fundamentals. It is about the market adjusting to a company evolving beyond traditional valuation models.
While most investors are trying to value Tesla like a car company, it’s spending this entire phase retooling itself into an AI and autonomy-first enterprise. That transition doesn't show up in EPS yet (but it will).
The Bigger Picture is Being Missed
The robotaxi rollout in Austin is live. Expansion into California, Phoenix, and Florida is on the roadmap.
Tesla is building a vertically integrated, owner-driven ride-hailing model that could eventually bypass both Uber and legacy OEMs entirely.
Optimus is no longer a lab prototype—it’s moving toward scalable production by 2026.
If Tesla even partially succeeds in general-purpose robotics, it will unlock a Technology Acceptance Model (TAM) that dwarfs the current EV narrative .
Daily Technical Outlook
We’re currently in a bullish compression, with higher lows forming against the resistance area of $365. If $280 holds and the price continues to grind within this wedge, it sets up a volatility breakout scenario.
The breakout level to watch is $335. A daily close above that reopens $365. And beyond that, the resistance level is at $426.
My View
Tesla is compressing, both in price and narrative.
The long game is quietly coming into focus, where the risk/reward skews asymmetrically in favor of the upside.
This daily compression won’t last forever, and when it resolves, the move will likely be outsized.
TSLA BUY+++ WEDGE FORMING $339 first targetTSLA, like AAPL, is forming a bullish wedge which likely will break to the upside. First target is $339 at wedge resistance then will reevaluate
Tesla in the waiting room as revenue slidesTesla is a global innovator that is changing the world. As a general rule, many investors have a saying: Never bet against Elon. They're not wrong. Elon delivers. But the short term is messy.
The stock is hovering around its 200-day moving average, a critical test. Break lower and we could see $290, maybe $260. That’s not panic, it's just price catching up to reality.
The auto business is deep in a downcycle. Q2 deliveries fell 14%, with revenue down 12%. Profits squeezed. Classic cyclical move. Nothing new here. But it’s weighing on momentum.
The upside isn’t about cars, it's autonomy, robotaxis, AI (Grok in cars). That’s where Tesla becomes a $2 trillion company. Musk knows it and is building for the future (100,000 GPU super cluster). He’s already shifting the story.
But that future is 6–12 months out, maybe longer.
In the meantime, we sit in the waiting room. Auto volumes need to stabilise. Robotaxi needs scale. Optimus requires proof and some definitive timeframes to get the market excited. That creates a 3–6 month narrative gap. Markets hate gaps.
Earnings last week were among the softest (though expected). EPS fell 23%. Free cash flow almost vanished. No real catalysts until next quarter. If the broader market sells off, which looks likely, Tesla takes more heat.
But let’s not lose the plot. Tesla is still Tesla. Long-term vision remains. Musk’s execution record is unmatched. Bet against him and you lose, eventually.
Short term, expect weakness. Patience required. If the stock breaks $315 with conviction, we’d expect further weakness before the real upside re-emerges.
Wait, watch, then pounce.
The forecasts provided herein are intended for informational purposes only and should not be construed as guarantees of future performance. This is an example only to enhance a consumer's understanding of the strategy being described above and is not to be taken as Blueberry Markets providing personal advice.
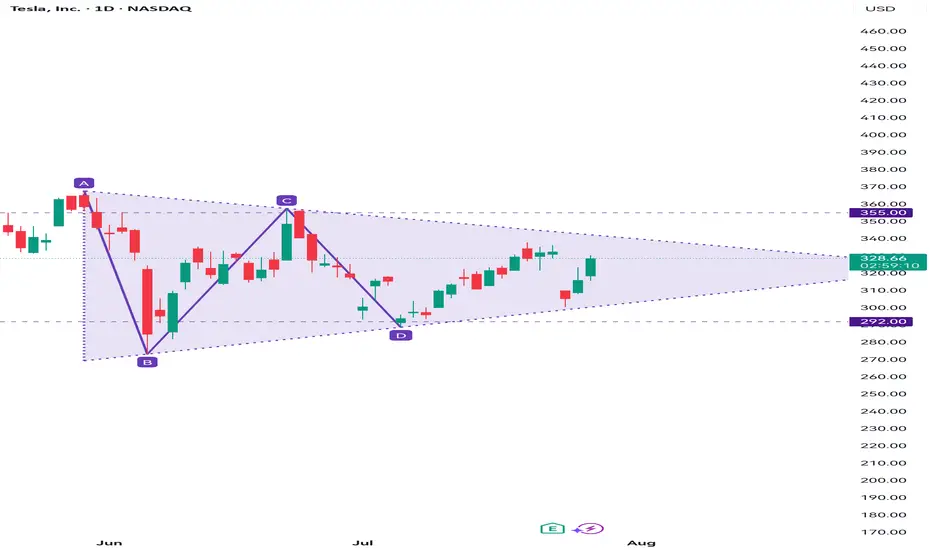
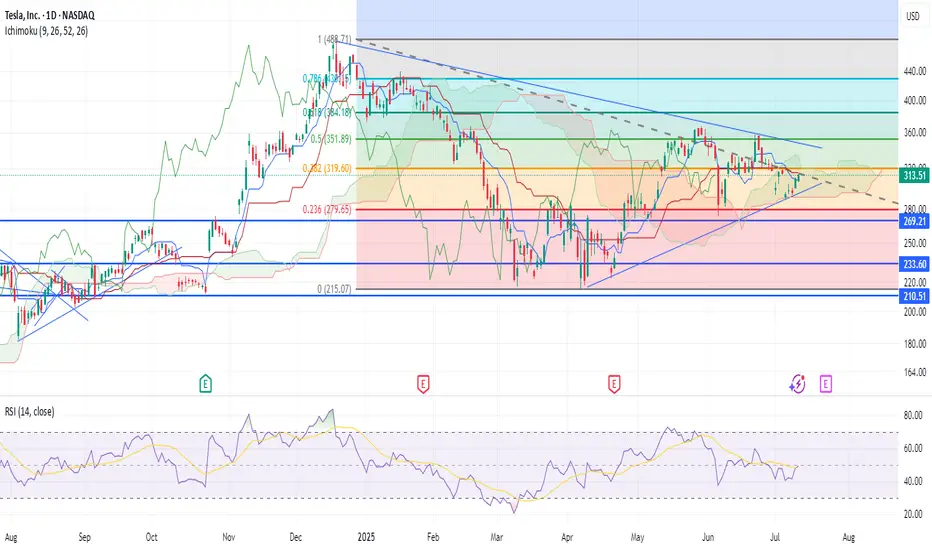
Inflection point"Tesla is at a binary point on the chart. The stock is wedged tightly between the red, downward-sloping resistance line (upper boundary) and the green, upward-sloping support line (lower boundary)—the classic apex of an asymmetrical triangle.
At this stage:
A breakout above the red resistance would be a clear bullish signal, potentially starting a new upward trend.
A rejection at resistance and breakdown below the green support would signal bearish momentum, with likely downside toward lower Fibonacci levels like 272.77 or 213.97.
With price at this inflection zone, the next decisive move—either up or down—will likely define Tesla’s short-to-medium-term trend. This is a textbook example of a binary technical situation: whichever direction is confirmed next, that’s likely to dictate the coming weeks' price action." (Some help from Perplexity)
$TSLA is in an accumulation phase.A classic Wyckoff scenario is playing out, offering a prime opportunity if you have the nerve for it.
Support: The key support zone is $300 - $305. As long as this holds, the bullish thesis is intact.
Resistance: The primary target is the top of the multi-month accumulation range, around $370 - $380. A breakout above this would signal the start of a major new markup phase.
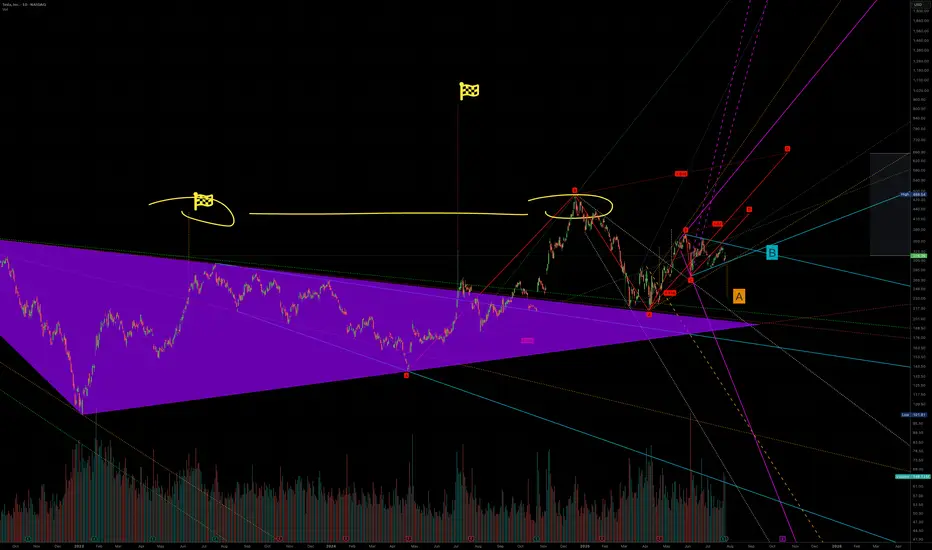
A to 236 or B killing A to 420Tesla is one of those stocks that is heavily manipulated algorithmically. When we were in an uptrend and needed a little push, a large fractal was created that could break a previously formed structure which should have taken us to $236(A). Interestingly, a very strong symmetrical triangle has emerged, influencing this upward movement, and the final price—due to some mystical reason—seems to be $420(B). It’s also worth noting that this whole move is being influenced by another similar structure whose target is above $600. So, if we analyze everything that’s happening, a 12% drop in sales means nothing compared to what Tesla will gain from robots, restaurants, and robotaxis, which I call RRR