UBER trade ideas

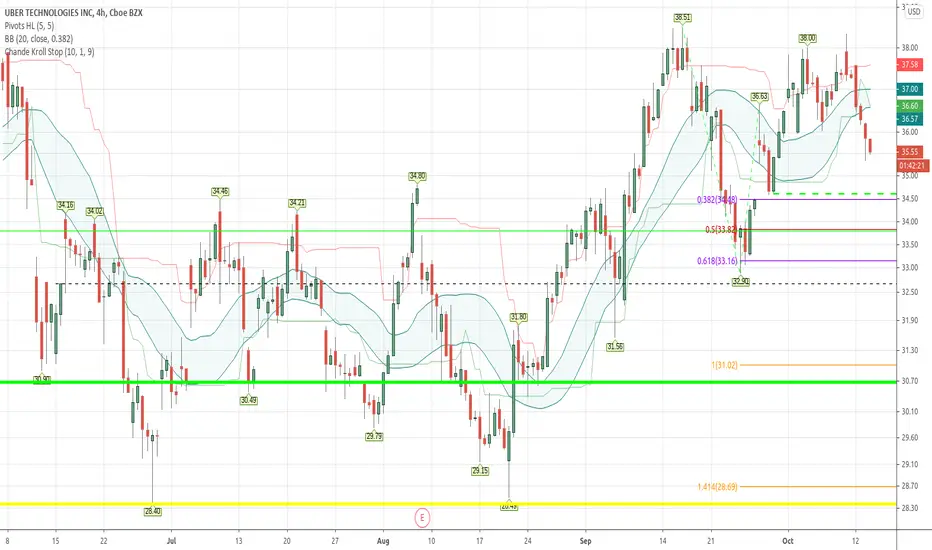
UBER critical lvl, expecting bounce off 50MAsupport at previous resistance, 50MA
very small wick shows good support & buying confidence.
Bull case:
expecting a good bounce up, best case aim for gap fill & forming a new trading zone between 34 - 38
Bear case:
SPY keeps dumping and 50MA support fail to hold, and break down further to test 100MA at $33

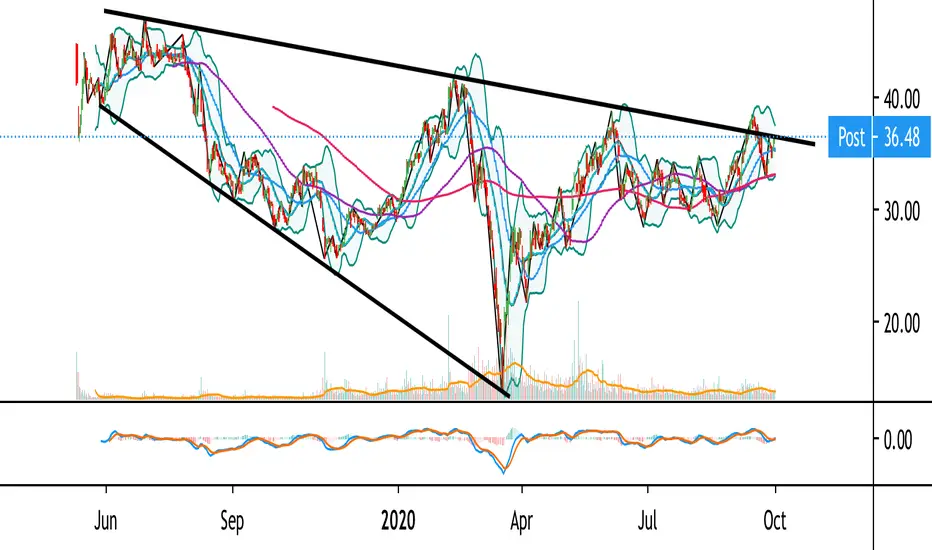
long term trendlinesthis one can go either way here! under the trendlines its a short over its a buy, goodluck

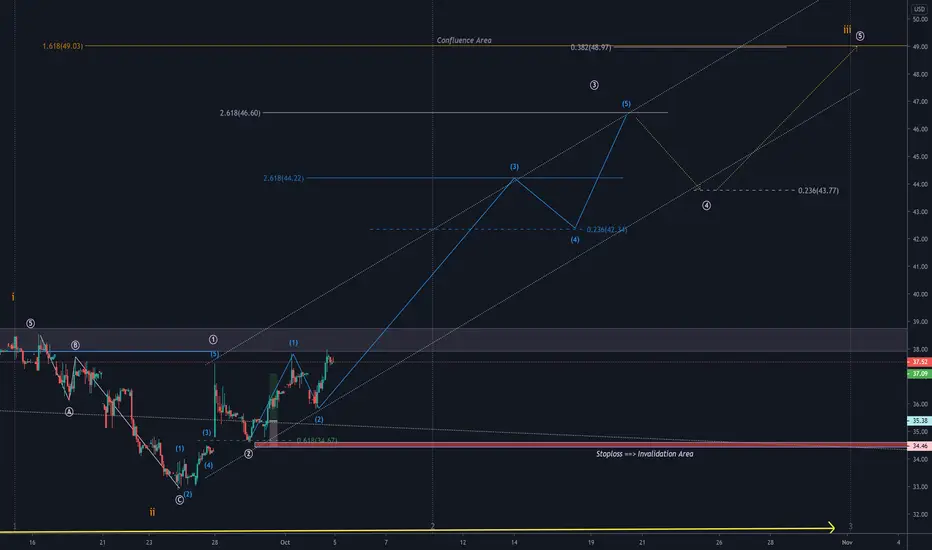
two scenarios here... Elliot Wave analysisfirst time doing this... one of two scenarios could go down. let's see what happens


Uber: View chart linked in descriptionView chart linked below. I don’t know how to force all days of the week on time scale so I charted Uber on a cryptocurrency chart.
Target price ranges between $63 and $90, but $66 is highly probable based on Wedge, EW, and Fib.


Uber: Trick or TreatDon’t fall for Uber’s trick, instead play nice and wait for it’s Treat. Yesterday, Uber didn’t gain like most of the market did. Instead, Uber faked a close under 20 DMA but bounced upwards right at close. That bounce coincides with a long term trend line that had been acting as resistance but now appears to act as support.
The pink vertical lines indicate bounces off the trend line by a high, low, open, or close price. If the trend line is valid support, then price could rally, slowly or quickly, to an ideal technical target price of $66. However, a more practical target price is closer to $54.
Like, follow, and let’s see what happens.


trying to push over that 37.80 areaCup & handle formed, but failed to get past the line of resistance for an upward continuation - let's see if we can get past it next week.

Potential cup and handle on 1hrtoday was a bit choppy after trump's stimulus tweet. let's see if this cup and handle goes as planned...

UBER Ready to Breakout From IPO BaseUBER has been building an IPO base for a while. Similar in look to SPOT and BYND before they broke out. And if you want to go to the 'way back machine' check out CHGG after it IPO'd. UBER has a chance to provide some huge returns. Watch for a break of the downtrend line and follow-through above the blue shaded area. Top of the watch list for me!


Uber centerfold: Doesn’t get sexier than this
10 20 50 and 100 DMAs
BB
macd
gaps
volume
... all confirming a possible breakout above the long-term wedge pattern.
Please wine and dine her first, gentlemen.
$UBERPossible Wedge Breakout Candidate (NEEDS MARKET HELP IMO)
- 30Min MACD crossing over
- 50D Crossing over 200D (Golden Cross)
- Trying to break 38 level and top trendline
Entry: 38 & Confirmation above trendline
Price Target: 39-41.5
With no market help and a red day/s, look for:
- Rejection off 38 level/Top Trendline
- 50D Crossing under 200D (Death Cross)
- Breaking of 200D/36 Support
Entry: 37.16 Support after 38 rejection
Price Target: 34.50 Support/Bottom Trendline

$UBER 4 Month #CupandHandle #ChartPatternNYSE:UBER been consolidating its rally from COVID19 bottom for the last 4 months forming a cup and handle chart pattern with $38.50 level acting as resistance. The stock is also attempting to clear a weekly down sloping trend line (red dotted line on the chart). A daily close above cup and handle chart pattern boundary will clear both chart pattern resistance and weekly trend line triggering a long entry swing trade.

10/04/2020 UBER Hi all,
Possible cup and handle bullish pattern.
Wait until UBER breaks RS1, and RS 1 becomes support.

Uber at resistance high from JuneUber closed at high from June, resistance tested 2 days in a row, it's very likely we see a retest for the 37.75 level after a breakout.
W/ the news from London, it's very likely we see a test for the high before march of $41.25, a more conservative target would be fib127lvl $40.
If not held, take short position and we may see it go to a higher low above $36

Bullish if break $38Uber has broke our first resistance trend line.
If it able to break above second resistance $38 resistance line, we will see bull trend intact.

