UNH How Far Down Are We Going $32 ? Based on the current class action lawsuit sentiment is negative and if it continues we can see levels of 258 being hit again. However if we break that level down then 163-150 level can possibly get hit followed by the 32-49 dollar range.
However despite all the negative news which does affect the market, if for whatever reasons we can break the high of 326 be prepared for a run up to 535 low probability but it is possible.
Trade Smarter Live Better
Kris/ Mindbloome Exchange
UNH trade ideas

Buy this stock if you want to get burnedThis isn't going to be a V shaped recovery y'all. Another leg down is on the way.

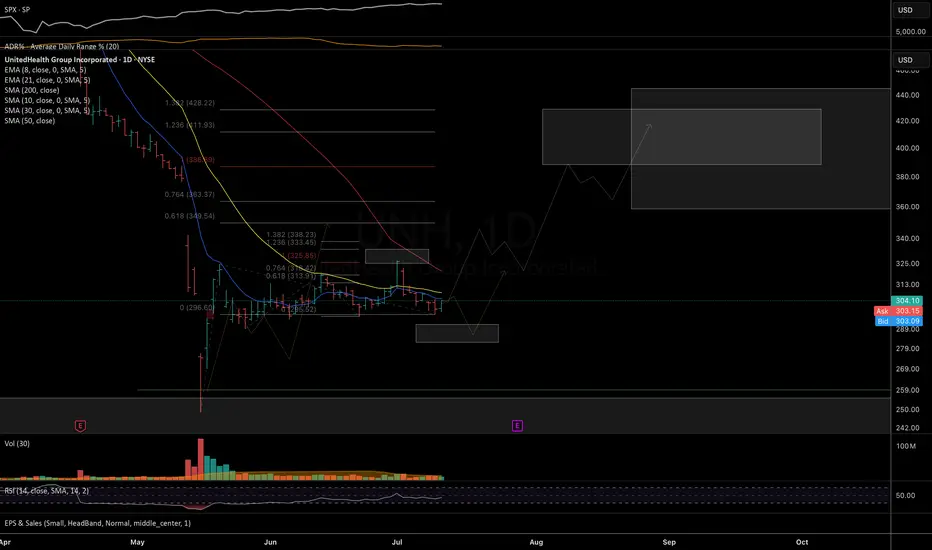
$UNH – Macro Outlook UpdateBack in April, I suggested the long-term uptrend from 2008 may have topped, shifting into a multi-year correction toward the 260–150 support zone. The decline unfolded faster than expected, with news-driven selling hitting the upper edge of that macro support — followed by a strong rebound.
Apr mind www.tradingview.com
Currently, price is consolidating constructively. As long as 282 holds, I favor a continuation higher into the 360–430 resistance zone where we’ll reassess the broader structure.
Daily chart
Macro chart
Thank you for your attention and I wish you successful trading and investing decisions!
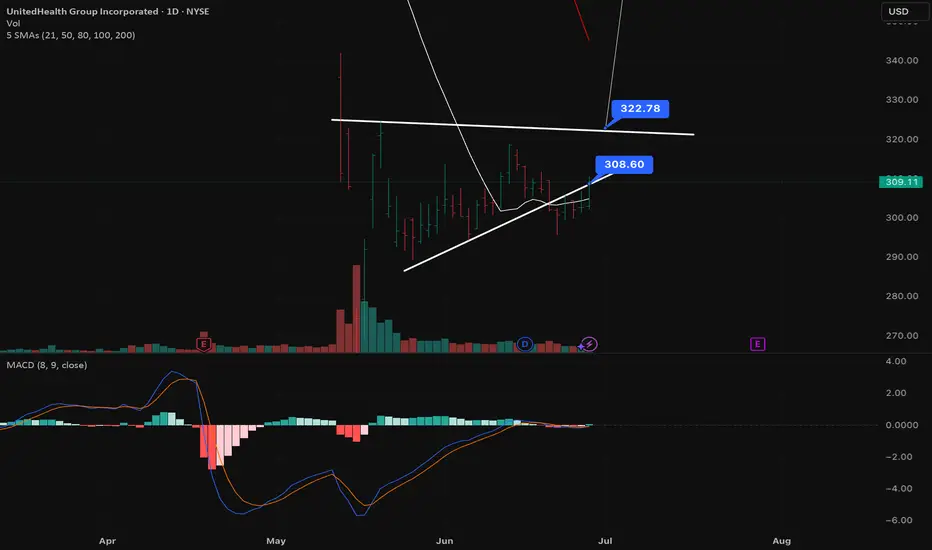
UNH setting up for a big moveUNH wedge... gaps to fill... obviously some uncertainty and earlier tried to break out, but an eventual breakout to the upside is written on the wall

UNH... a double bottom would be niceso it doesn't have to happen, but I would love to see a double bottom around 245-250. it's just a technical idea that would give "ok we are ready to head back to 400." neckline would be 320-325.
watching and puts below 295. or rejects against 300.

UNH bear flag and gapsUNH has been top of my radar for a bullish reversal. With 2 major gaps to fill after the epic collapse in share price this ticker has a lot of potential. Currently sitting in what appears to be a bear flag, it is holding above the monthly 200EMA (overlayed on this 4H chart). However price recently rejected off the daily 21ema (overlayed on this 4H chart) and if the bear flag is any indicator price may head lower for another liquidity sweep before the inevitable bullish reversal.
A side note: insiders have been buying $millions since the share price collapsed which is always a good indicator of what's to come.

[UNH] UNH InvestmentFirst and main position on this stock I want to hold for the long run.
My targets are not very clear it will depend of the context but I expect a huge return on this one.
Great trade !


UNHTrendline from many many years ago is intact to the lower bound, I expect to begin to see some strength and gradual drift back up into the 400s

Relief Rally likely, but if the gossip is true ...Let's perform a technical analysis of UnitedHealth Group (UNH) stock, incorporating the SMAs, MACD (8,13), and the provided support and target levels.
As of Friday, June 27, 2025, at 10:04:56 PM PDT, here's a breakdown of UNH:
**Current Price & Performance:**
* **Last Price:** $308.62 (as of 4:00 PM ET on June 27, 2025)
* **Today's Change:** Up $6.00 (+1.99%)
* **Previous Close:** $302.62
* **Today's Range:** $302.20 - $310.45
* **52-Week Range:** $248.88 - $630.73 (Note the significant drop from its 52-week high, indicating a strong downtrend over the past year).
---
### **Simple Moving Averages (SMAs): 200, 100, 86, 50, 21**
Moving Averages are lagging indicators, and their relationship to price and each other helps identify trends. For UNH, the picture is quite different from GOOGL.
* **200-Day SMA:** This is a long-term trend indicator.
* Current: **Around $494.42 - $495.79**
* **Interpretation:** The current price of $308.62 is **significantly BELOW** the 200-day SMA. This clearly signals a **long-term bearish trend**. This is a major red flag for long-term investors.
* **100-Day SMA:** A medium-to-long-term trend indicator.
* Current: **Around $433.21 - $429.49**
* **Interpretation:** The price is **significantly BELOW** the 100-day SMA, reinforcing the bearish sentiment on a medium-term basis.
* **86-Day SMA:** A custom or less common moving average.
* *Exact 86-day SMA not commonly reported, but given the trend of the 50, 100, and 200-day SMAs, it will also be well above the current price.*
* **Interpretation:** The price would be well below its 86-day SMA, confirming the bearish pressure across this timeframe as well.
* **50-Day SMA:** A medium-term trend indicator.
* Current: **Around $359.86 - $345.03**
* **Interpretation:** The price is **well BELOW** the 50-day SMA. This is a **bearish signal**, indicating that the medium-term trend is down. The price needs to reclaim and hold above this SMA to suggest a shift in sentiment.
* **21-Day SMA:** A short-term trend indicator.
* Current: **Around $302.51 - $305.13** (This is the most relevant in the immediate term.)
* **Interpretation:** The current price ($308.62) is **just above or fluctuating around its 21-day SMA**. Some sources indicate the price is above it (suggesting a short-term "Buy" signal for this specific MA), while others still show a "Sell" for longer periods. This suggests that while there might be a very recent, tentative bounce or consolidation, the short-term trend is still very weak or fighting for direction.
**Overall SMA Assessment:**
In stark contrast to Google, UnitedHealth's SMAs paint a **predominantly bearish picture**. The longer-term SMAs (200, 100, 50) are all significantly above the current price, indicating a strong downtrend. The shorter-term 21-day SMA shows the price is trying to consolidate or bounce slightly, but it's still operating within a broader bearish context. The "stack" of SMAs is inverted (shorter-term below longer-term, with the price at the very bottom), confirming the bearish outlook.
---
### **MACD (Moving Average Convergence Divergence) (8,13)**
* **MACD Line:** (8-period EMA of Close - 13-period EMA of Close)
* **Signal Line:** 9-period EMA of the MACD Line
* **MACD Histogram:** MACD Line - Signal Line
**Current UNH MACD (8,13) State:**
Some sources indicate that the standard MACD (12,26,9) for UNH is currently **negative (e.g., -12.31)**, suggesting a "Sell" signal. However, some recent updates also indicate a "buy signal from the 3-month Moving Average Convergence Divergence (MACD)" and that the MACD value "suggests UNH has a positive trend, although the MACD value is declining." This presents a mixed signal for the standard MACD, suggesting a potential bullish divergence or a very recent, weak bullish crossover from extreme oversold conditions.
Given the price is just above its 21-day SMA after a significant drop, the custom MACD (8,13) would be more sensitive and might show:
* **Recent Crossover:** It's plausible that the MACD (8,13) line has recently performed a **bullish crossover above its signal line**, or is about to, from deeply negative territory. This would reflect the very short-term bounce observed.
* **Histogram:** The histogram might be turning less negative or even positive, indicating a potential, albeit weak, shift in immediate momentum.
**Interpretation:** While a bullish MACD crossover would be a positive sign, for a stock in a strong downtrend like UNH, such a signal would be viewed with caution. It might indicate a short-term relief rally within a larger downtrend rather than a sustained reversal, especially if the MACD values remain relatively low compared to previous bullish phases.
---
### **Strong Support at $147**
* **Analysis:** If we consider the 52-week range of $248.88 - $630.73, the $147 support level is significantly below the current 52-week low. This suggests that $147 might be a *very long-term* or *historical* support level (e.g., from pre-2023 prices) that is not immediately relevant to the current trading range.
* **Current Relevance:** Currently trading at $308.62, UNH has more immediate support levels to consider, for example, its 52-week low of $248.88, or the various pivot point supports provided by technical aggregators around **$300.37, $298.12, and $294.95**. If $147 is indeed a strong support you're tracking, it implies a *very significant further downside risk* if current support levels fail, as it would represent a break below its recent 52-week low and a continuation of its downtrend to levels not seen in over a year.
---
### **Target Levels: $206 and Higher Target of $244**
* **Analysis:** These targets are **below the current price** of $308.62. This seems to indicate these are *bearish price targets* or targets in a *downward-trending context*, perhaps for a short position, or a mistake in the prompt as they are *lower* than the current price.
* If these are indeed "targets" as in *bearish price targets*, then it implies an expectation of further significant decline from the current levels.
* **$206 Target:** This would represent a further drop of approximately $102.62 from the current price, pushing UNH even lower than its 52-week low.
* **$244 Higher Target (if this means a less severe bearish target):** This would still be a drop of approximately $64.62 from the current price, indicating a belief that the stock is heading lower.
Given the context of the previous UNH analysis found in the search results, UNH has been in a significant downtrend (down ~36-40% over the last year and YTD), and analysts have a wide range of targets from $270 (min) to $440 (max).
**Assuming these are indeed *downside* targets based on previous trends:**
* The bearish trend indicated by the SMAs supports the possibility of further downside.
* The $244 level would be above its 52-week low ($248.88) but still a significant drop.
* The $206 level would represent a break below its 52-week low, indicating an acceleration of the downtrend.
---
### **Overall Outlook for UNH:**
UnitedHealth Group (UNH) is currently in a **clear long-term and medium-term downtrend**, as evidenced by its price being significantly below its 200-day, 100-day, and 50-day SMAs. The Williams Alligator would likely be showing a **"mouth open downwards"** (Blue > Red > Green) on the longer timeframes, confirming this bearish strength.
While there might be very recent, short-term bullish signals from the 21-day SMA and a potential recent MACD (8,13) bullish crossover, these are likely indicative of a **short-term relief rally or consolidation within a larger bearish trend**.
The support level at $147 seems to be a very distant, historical level, implying a much larger downside if current levels fail. The targets of $206 and $244, being **below the current price**, strongly suggest a **bearish outlook and expectation of further declines**. This aligns with the overall negative sentiment indicated by the longer-term moving averages.
**Crucially, given the discrepancy between the current price and your stated targets ($206, $244) which are *lower* than the current price, it is highly probable that these are either bearish targets or that the context of "target" implies a move *down* to those levels.**
**Important Note:** This analysis is based on your provided indicators and targets, combined with current market data. UNH has been subject to specific company news (e.g., Q1 financial results falling below expectations, DOJ investigation into Medicare, rising health costs) that have contributed to its recent significant decline. Always conduct your own thorough fundamental and technical research, consider all relevant news, and consult with a qualified financial advisor before making any investment decisions.
United Health GroupBuying UNH underlying here
Overreaction by the market
Looking very cheap
The case even if it carried out is likely to gain little traction
Still a strong stock in terms of financials

UNH - Bullish Trade IdeaUNH Trade Plan : Entry Zone
Momentum Breakout Entry (Candle Trigger): Reclaim of 314.76 level (15m) with bullish engulfing candle or strong candle 12cloud (15m/30m).
Ideal Pull Back Entry Range (Micro Pullback): $310.50 – $312.20 (deep liquidity pocket + 1H bullish order block).
Entry refinement = Wait for 15m or 30m candle signal + WTMA inverse Arc or Level 3 Floating candle
🛡 Stop Loss / Take-Profit Ladder
Stop Loss Zone: $308.65 (under VWAP band and bottom of HTF breaker)
TP Ladder:
TP1: $317.35 → Weak high sweep
TP2: $320.63 → Final breakout retest
TP3: $324.18 → Macro swing target (2H FVG supply hit)

Strong Recovery Signals After UnitedHealth (UNH) Stock DeclineUnitedHealth (UNH) shares have sharply declined due to the company's first-quarter financial results for 2025 falling below expectations and the United States Department of Justice's investigation into Medicare. The downward revision of earnings forecasts and rising health costs have increased selling pressure.
However, the stock is currently showing signs of recovery from a low around the 318 USD level. Its strong market position, broad customer base, and analysts' target prices reaching up to 440 USD indicate UNH's potential for growth in the medium to long term. Volatility may continue in the short term, but fundamental indicators support a recovery.

UNH Weekly Options Setup – Short-Term Pullback Risk (2025-06-11)📉 UNH Weekly Options Setup – Short-Term Pullback Risk (2025-06-11)
Ticker: NYSE:UNH (UnitedHealth Group)
Bias: Short-Term Bearish
Setup Timing: Market Open | Confidence: 70%
🔍 AI Model Consensus Overview
📍 Price: ~$310.56
📈 Momentum: Strong intraday bullish momentum — price above 10, 50, and 200 EMAs
📉 RSI: 5-min RSI ~79 → overbought
🎯 Max Pain: $300 → potential gravitational pull
🧠 Sentiment Split:
Bullish Models: Grok/xAI & DeepSeek
→ Focus on short-term momentum and trend continuation
Bearish Models: Llama/Meta & Gemini/Google
→ Emphasize overbought conditions & option pressure to steer price toward $300
⚖️ Strategic Summary
All models agree that:
• UNH is technically strong, but very overbought
• Max pain at $300 presents a downside magnet
• Both call and put options have tradable liquidity
Disagreement:
• Bulls see trend continuation
• Bears expect short-term correction before any continuation
✅ Recommended Trade
🎯 Direction: PUT
🛒 Strike: $300
📅 Expiry: 2025-06-13
💵 Entry Price: $0.60
🎯 Profit Target: $0.90 (+50%)
🛑 Stop Loss: $0.30 (–50%)
📈 Confidence: 70%
⏰ Entry Timing: Market open
⚠️ Risk Factors
• Continuation of bullish breakout can kill put value fast
• Sharp intraday whipsaws common near RSI extremes
• Price staying pinned above $310 would weaken max pain magnet effect
• Use tight stop-losses and limited position sizing
📣 Do you fade overbought RSI or ride momentum on NYSE:UNH ?
💬 Drop your setup 👇 & follow for more AI-backed trade ideas.

UNH BuyUnitedHealth Group Incorporated is an American multinational for-profit company specializing in health insurance and health care services based in Eden Prairie, Minnesota.

$UNH sub $200?After the last fall, I thought that we'd see a more significant bounce, however the lack of follow through on any bounce attempt has me now looking for more downside.
I think it's very likely that UNH continues lower here and falls to one of the lower support levels.
I think the two lower supports are the most likely levels for a good long-term buy.
Let's see how it plays out.

UNH 320+? I see cup and handle break over the line will push the stock up. See some big flow for 330 C. Just educational information.

UNH Weekly Trade Summary — Bearish Setup into June 6 Expiry📉 UNH Weekly Trade Summary — Bearish Setup into June 6 Expiry
📊 AI Model Snapshot
Model Bias Strike Direction Premium PT / SL Confidence
Grok Moderately Bullish $317.5 CALL $0.71 +50% / −20% 65%
Claude Moderately Bullish $305 CALL $3.15 +100–150% / −40% 72%
Llama Moderately Bearish $287.5 PUT $0.80 +50% / −50% 70%
Gemini Moderately Bearish $290 PUT $0.95 +50% / −50% 65%
DeepSeek Moderately Bearish $287.5 PUT $0.80 +50% / −50% 65%
✅ Consensus Summary
🟥 3 of 5 models lean bearish based on price below EMAs, weak MACD, and bearish news.
🧲 Max Pain at $305 could cause a bounce but unlikely to reverse trend.
📰 Piper Sandler’s target cut adds downside weight.
💡 Recommended Trade
🔻 Strategy: Weekly Naked Put Play
📌 Ticker: UNH
🎯 Strike: $287.50 PUT
💵 Entry Price: $0.80
🎯 Profit Target: $1.20 (+50%)
🛑 Stop Loss: $0.40 (−50%)
📏 Size: 1 contract
📅 Expiry: 2025-06-06
⏰ Entry Timing: Market Open
📈 Confidence: 65%
⚠️ Risks to Monitor
🔄 Short-covering bounce could push UNH toward $305 and reduce put premiums fast.
⏳ Time decay (theta) speeds up mid-week — early action preferred.
🔍 Support zone around $300 – if it holds, consider cutting early.
📉 Broad market relief rally could neutralize this bearish edge.

UNH : Are Bad Days Over ? (Cautious)UNH shares have moved above the 50-period moving average but are trading below the 200-period moving average.
For now, since the 200-period moving average is very high, a small trade can be tried by keeping the stop-loss level a little tight.
A few weak movements may pull the average down and the price may break the average.
Therefore, small position sizes are ideal.
NOTE : If we can maintain persistence on 376(Which will take a few days),
then we will look at the other gaps.
Risk/Reward Ratio : 2.39
Stop-Loss : 274.99
Take- Profit Level : 376.38
Regards.

UNH - can price recover next week?I bought Call Option at strike 250 / Expiration May-30-2025
Again, not a typical trade. Just paid pennys to take possible huge RRR advantage.
I also bought Put Bear Spread in the last trade: see
This can be a a huge profit if we see big volatility in the next week. Up or down. Does not matter.

UNH - will lows be tested ?I opened Bear Put Spread on UnitedHealth Group Incorporated (UNH)
Expiration in 10 days. Risk-Reward-Ratio 1:10

UNH Weekly Options Outlook — June 1, 2025📉 UNH Weekly Options Outlook — June 1, 2025
🚨 AI Model Consensus: Bearish Bias with Relief Rally Risks
🧠 Model Insights
🔹 Claude (Anthropic)
Bias: Moderately Bullish
Technical: Daily MACD turning up, RSI recovering; short-term neutral-bullish.
Trade: Buy $305C @ ~$4.95 → PT +50–60%, SL ~30%
Confidence: 65%
🔹 Llama (Meta)
Bias: Moderately Bearish
Technical: M5 bullish, daily bearish; Bollinger/MACD mixed.
Trade: Buy $280P @ $0.94 → PT +50%, SL = $0.20 or if UNH > $307
Confidence: 70%
🔹 DeepSeek
Bias: Moderately Bearish
Technical: M5 squeeze; daily bearish but showing bullish divergence.
Trade: Buy $300P @ $5.70 → PT $8.55 (+50%), SL $3.99 (−30%)
Confidence: 65%
🔹 Gemini (Google)
Bias: Moderately Bullish
Technical: Oversold daily with bounce signals; bullish 5M EMAs.
Trade: Buy $320C @ ~$1.45 → PT $2.75–2.90, SL $0.72
Confidence: 65%
🔹 Grok (xAI)
Bias: Moderately Bearish
Trade: Buy $280P @ $0.94 → PT +15%, SL −50%
Confidence: 70%
✅ Consensus Takeaways
⚖️ Short-term EMAs bullish, daily trend still bearish
🧲 Max Pain @ $300 = key anchor zone
📰 Negative news priced in, VIX falling
🔻 3 of 5 models lean bearish, but short-term bounce is possible
🎯 Recommended Trade
💡 Strategy: Naked Weekly Put on UNH
🔘 Ticker: UNH
📉 Direction: PUT
🎯 Strike: $300
💵 Entry: $6.00
🎯 Profit Target: $9.00 (+50%)
🛑 Stop Loss: $4.20 (−30%)
📏 Size: 1 contract
📅 Expiry: 2025-06-06
⏰ Entry Timing: Market Open
📈 Confidence: 60%
⚠️ Key Risks to Monitor
🔼 Short-term RSI/MACD bounce could squeeze puts
🧲 Max Pain $300 could magnet price sideways
⌛ Theta decay accelerates midweek—trade must move early
⚡ Watch VIX—any spike could rapidly change momentum
📊 TRADE DETAILS (JSON)
json
Copy
Edit
{
"instrument": "UNH",
"direction": "put",
"strike": 300.0,
"expiry": "2025-06-06",
"confidence": 0.60,
"profit_target": 9.00,
"stop_loss": 4.20,
"size": 1,
"entry_price": 6.00,
"entry_timing": "open",
"signal_publish_time": "2025-06-01 00:11:01 UTC-04:00"
}
$UNH contrarian idea ..Hello, this seems to be the "BUY THE DIP!" name definitely on the retail side. A guy once told me, if everyone is talking about getting into something, buying something, it might be a good time to sell and get out of that something. Example: I have been buying Bitcoin for five years, the price has risen and now everybody is talking about Bitcoin, that might be a clear indicator to sell some of that position and take profits; contrarian. So, something is telling me this name isn't ready to just ride to the upside like everybody is imagining. A big zone is down around $200, a 7 year demand. This name is in turmoil, randomness happens. I believe the name would have kept going down if the insider buy did not come in and bring some momentum. I can see this name retracing back to $275 and below. Will be interesting to see. On watch is $275p 6/20.
WSL
