United Health - a buy for meI would be careful and wouldn´t leverage or bet on any options, but as a great longterm investment for sure. I can explain in a long comment what my reasons are but this will take a lot of time and is not worth mentioning here for now.
UNH trade ideas

$UNH still looks very uglyI'm still bearish on NYSE:UNH until 335-340 area gets taken out. The chart is so ugly. We've seen many "too big to fail" companies die out eventually. Will NYSE:UNH survive all this bad publicity? Insider action, options flow suggest this isn't going "parabolic" anytime soon lol sorry bulls
The technicals just don't align YET to the upside.
This is still so far from major moving averages on the higher time frames... the volume dried out after those huge moves and consumers hate them right now lol.. this is feeling like NYSE:GME apes versus wall street bullies. Except its NYSE:UNH versus the insured consumers finance.yahoo.com
20EMA on the daily = 342 still not even close
Also FYI - NYSE:UNH is not the type of stock that goes parabolic, nothing sexy on the options flow either
Below 290, I've got 275, 260, and 210 gap down. Good luck bulls and bears

UNHOver sold on the weekly here.
Daily MACD just flipped bullish .
Last weekly candle was an Inverted hammer
Looking for a big move back to 380 before summer is out..
Bullish Pennant setup here

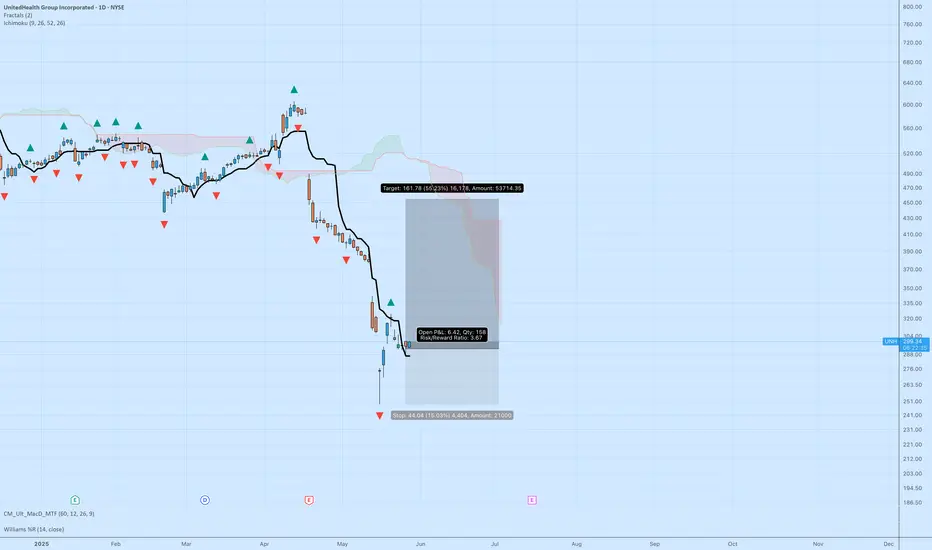
UNH Long Setup – Oversold Reversal PlayUnitedHealth ( NYSE:UNH ) is showing early signs of a potential bounce after a brutal selloff.
🔹 Price broke above the baseline (Ichimoku), first green candle close with bullish momentum
🔹 Williams %R showing oversold bounce from -80 levels
🔹 MACD turning positive on multiple timeframes
🔹 Clean risk/reward setup:
‣ Entry: $293
‣ Target: $455 (55% upside)
‣ Stop: $249 (15% risk)
‣ R/R Ratio: 3.5+
This could be a high-reward reversal play if market strength continues. Watching closely for follow-through confirmation.
#UNH #stocks #longsetup #tradingview #healthcare #swingtrade #technicalanalysis #chartsetup #Ichimoku
UNH Under Pressure – Below EMA 200 with Heavy Selling VolumeUNH (UnitedHealth) is showing clear bearish signs:
Price has dropped below the EMA 200, a key long-term support level
Recent sessions show strong selling volume, indicating institutional exit
Trend is downward, with no bullish confirmation yet
⚠️ I stay cautious here — waiting for volume shift or price reclaim above EMA before considering a reversal.
Until then, the bearish momentum stays active.
Not financial advice – just my technical view.
#UNH #StockAnalysis #BearishTrend #VolumeAnalysis #EMA200 #TechnicalTrading #HealthcareStocks

Near-Term Rebound or Continued Weakness Ahead?
Targets:
- T1 = $301.50
- T2 = $308.00
Stop Levels:
- S1 = $287.50
- S2 = $283.00
**Wisdom of Professional Traders:**
This analysis synthesizes insights from thousands of professional traders and market experts, leveraging collective intelligence to identify high-probability trade setups. The wisdom of crowds principle suggests that aggregated market perspectives from experienced professionals often outperform individual forecasts, reducing cognitive biases and highlighting consensus opportunities in UnitedHealth Group.
**Key Insights:**
UnitedHealth Group (UNH) finds itself at a technical and strategic inflection point, presenting opportunities for near-term positioning. This healthcare giant has struggled with recent sector-wide headwinds, including concerns around reimbursement rates and broader market volatility. The $295 level represents a significant area of consolidation, with resistance looming around $300-$308. Analysts emphasize close monitoring of volume spikes as they could signal either bullish conviction or continuation of recent weakness.
A deeper dive into sector fundamentals indicates that defensive healthcare stocks may benefit from a potential market rotation, particularly if the broader market encounters volatility. UnitedHealth Group's dominating position within managed healthcare leaves it well-positioned long-term, but short-term sentiment has weighed heavily, leading to over 10% declines in the last month.
**Recent Performance:**
Shares of UNH have declined in tandem with broader healthcare indices, lagging behind key benchmark ETFs like XLV. Over the last month, the stock dropped sharply from the $330 range and now faces strong technical resistance near $300. Recent market weakness reflects unfavorable investor sentiment as well as concerns over federal investigations and leadership uncertainty.
Expert Analysis:
From a technical perspective, traders point to the $287-$290 range as a critical support zone. A bounce off these levels could lead to short-term retracement opportunities targeting $301 and $308. Below $287, the stock could face further downside to the $275 level. Expert traders recommend cautious LONG positions, highlighting the importance of clearly defined stop-loss orders to navigate the current turbulent environment. Sentiment remains mixed due to ongoing investigations into Medicare billing practices.
News Impact:
Recent headlines around a federal probe into UnitedHealth’s Medicare business and the resignation of its CEO have created a cloud of uncertainty around the stock. This type of news-driven sentiment has weighed heavily on the share price and could limit near-term upside unless key questions around corporate governance and regulatory compliance are addressed.
Trading Recommendation:
Considering its current technical levels and mixed sentiment, we adopt a cautiously bullish stance on UNH. Traders may consider entering LONG positions near $295 with a stop-loss below $287 to protect initial capital. Upside targets of $301 and $308 are realistic in the short term, but disciplined risk management is critical given heightened volatility within the healthcare sector.

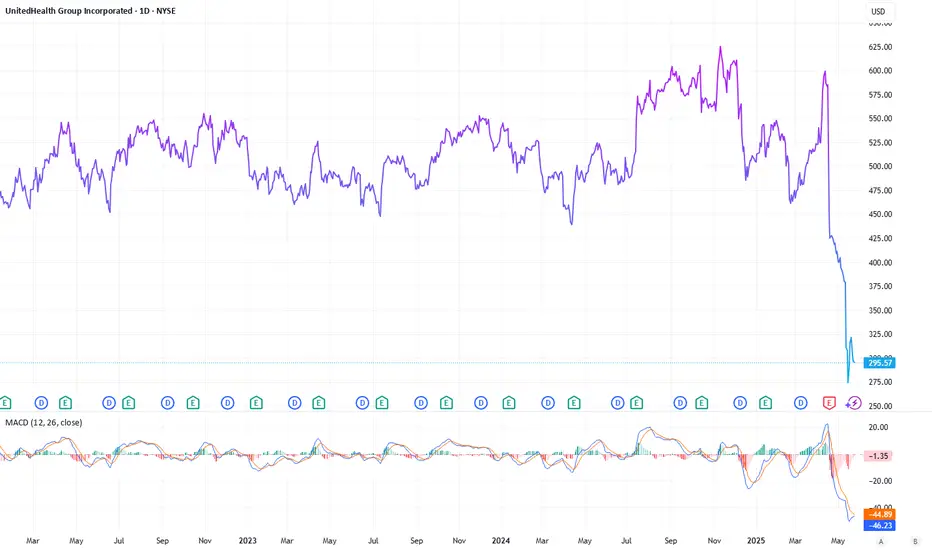
UnitedHealth Group:A Healthcare Giant Undervalued Amid AI GrowthUnitedHealth Group NYSE:UNH , the largest health insurer in the U.S., has faced turbulence, with its stock dropping from $600 to $295.57-a 53.1% decline since its peak. Despite challenges, UNH presents a compelling value play, leveraging AI to drive growth and efficiency. Here’s why investors should consider this healthcare titan at its current price.
A Rough Road: DOJ Probe and Public Backlash
UNH’s recent struggles stem from two major events. In December 2024, Brian Thompson, CEO of its insurance division, passed away in New York City, sparking criticism of UNH and the U.S. health insurance system. Following this, the U.S. Department of Justice launched an investigation in early 2025, alleging potential Medicare fraud through inflated treatment costs in UNH’s Medicare Advantage business. These events have shaved over $225 billion off UNH’s market cap since November 2024, bringing it to $264.80 billion.
However, such challenges are not something new for large corporations. Historically, giants like UNH settle regulatory issues with fines rather than severe penalties. Warren Buffett’s Berkshire Hathaway NYSE:BRK.A remains a major shareholder, signaling confidence in UNH’s governance and long-term stability.
Financial Strength and Undervaluation
Despite the selloff, UNH’s fundamentals remain robust. The stock trades at a P/E ratio of 11.4x, down from 17 earlier in May 2025, reflecting the price drop. Analysts project 2025 EPS at $30, implying a forward P/E of 9.7-a bargain for a company of UNH’s stature. Its 3.1% dividend yield, bolstered by 15 years of consecutive increases, adds income appeal. With a market-leading position, serving ~150 million individuals globally, and strong cash flows, UNH is well-positioned to weather short-term storms.
AI: A Catalyst for Growth
UNH is harnessing AI to transform its operations. Handling ~5 billion claims annually, the company uses AI to automate claims processing, reducing costs and boosting margins. AI also analyzes patient data to assist doctors with treatment decisions, enhancing care quality. Beyond internal efficiency, UNH aims to monetize this technology by selling AI solutions to other insurers and medical institutions, opening a new revenue stream. Such moves and steps in this way aligns with UNH’s broader strategy of leveraging technology to modernize healthcare, as seen in its Optum division’s focus on data analytics and pharmacy services.
Investment Case: Buy on Weakness?
At $295.57, UNH is undervalued, offering a margin of safety for long-term investors. Its forward P/E of 9.7 and 3.1% dividend yield make it attractive, while AI-driven growth positions it for future gains. Risks remain, as usual-regulatory fines and market volatility could pressure the stock-but healthcare’s resilience and UNH’s leadership mitigate these concerns. Investors seeking a stable, growth-oriented play in a turbulent market may find UNH as a pretty well buy case.
$UNH ONCE IN A LIFETIME FIBONACCI HARMONIC 60% DROP from ALL TIMNYSE:UNH ONCE IN A LIFETIME FIBONACCI HARMONIC 60% DROP from ALL TIME HIGHS
You cant make this up OVER 20% from the ALGO 618 buy at 250!
Im going for a LOW risk HIGH REWARD PLAY WAITING for A DIP FIRST! I think we MIGHT retest 250 so I WILL BE PAY TIENT here!
I will UPDATE all HERE NO CHARGE just show me some support
Drop a 👍

$UNH SHORT Excessive Retail Call OptionsMarkets Makers can not afford to pay calls amounting to this magnitude. We will see an extended push down to the low 200s and we will build support there for several weeks before moving up again.

UNH watch $288-297: Double Golden zone a serious Long Term Buy?UNH keeps getting bad news but may have bottomed.
Wave may have tested Double Golden fibs successfully.
Looking for some consolidation then launch of recovery.
$287.91-296.92 (Gold) is the key zone of interest.
$382.05-384.18 (Red) is the first long term target.
$251.94-255.83 (Green) is the MUST_HOLD bottom.
.
Previous Analysis that caught the top EXACTLY
Follow and Boost to encourage more such PRECISE charts.
==================================================
.

$UNH the bounce continues higherI think it's likely that we continue higher from here. I could see us finding a short term top somewhere between the 3 resistances above.
Let's see how high we go.
$396 is the target I will likely taking profits.

UNH bullish trend to continueElliot waves take a break after an impulsive streak, that's what we can see here.
The stock held the critical $300-ish Fib level and now reversing, having left the oversold zone getting ready for its next upward stretch.
Holding $321 is the next challenge, but rest assured a company with 400 billion annual rev isn't going anywhere. The press smears won't stick either.
Enjoy the recovery ride!

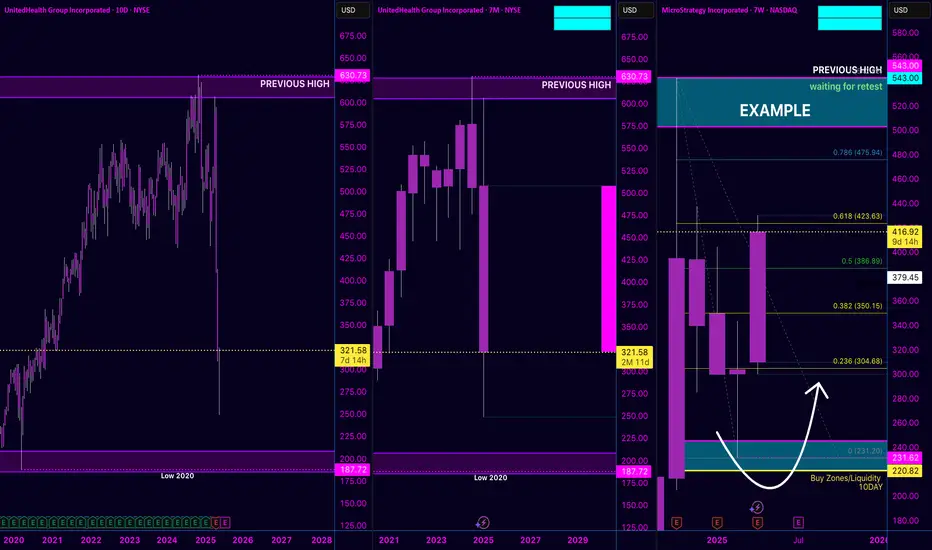
Not All Hype = Opportunity | UnitedHealth $UNH Analysis
Lately, I’ve been seeing a lot of chatter about buying NYSE:UNH — UnitedHealth Group — as if it’s the “big opportunity” after the drop…
But let’s keep it real — the chart isn’t confirming that yet. 👀
Take a close look 👇
Price completely broke structure from previous highs around $630.
The recent drop was aggressive, and there's no clean retest or setup forming yet.
Unlike NASDAQ:MSTR (MicroStrategy), which gave us a structured pullback and liquidity sweep, NYSE:UNH still looks like it has more downside to go.
⚠️ I’m not rushing in because the news or a rumor says “buy now.”
I’d rather wait for a clearer structure, a lower low, and a reaction from a real demand zone — just like the example I marked on MicroStrategy.
This is a great reminder:
Let price tell you when it's time — not social media hype.
For now, NYSE:UNH goes on the watchlist, not the buy list. 📉🧠
Dont jump to buy United Healthcare - LongUnited healthcare a leading insurance provider with around 15% market share will be a good buy but wait for it drop more and settle around 280-240$ which was the previous resistance prior to covid. Wait and buy at those levels for long term portfolio.

Generational Buy - Congratulations Well done to those that bought the dip on this below $300. I filled 80% of my position at $250 - the Point of Control according to the highest volume node.
We had a capitulation in the top healthcare insurer. Absolute peak fear given the long list of events which culminated in the CEO leaving. His departure could have been the final flush out as holders capitulated.
This presented a unique opportunity to get in on an undervalued stock trading at a P/E of 11.1.
I’m a trader, so I won’t comment on the ethics of this company, it’s beyond the scope of my work.
Technically I expect this relief rally to continue but in a corrective fashion with a potential resistance level looming. The 5th wave ending is normally followed by an abc correction, wave A has concluded, wave B is in play so I expect onward bullish recovery. For confluence, the weekly RSI had a complete reset hitting level of 30, the most oversold in many years. My indicator has flashed green (buy) so $250 could have been a generational low.
None of this is financial advice, I got in at a good entry and I have a stop loss in place if this poops the bed again.

UnitedHealth long term predictionSee text on chart. It's based on RSI, financial statements, news and technical analysis of support and resistance.
The huge drop due to the CEO stepping down is an overreaction from the market. Go long to 400 for low risk and to 440 with medium risk. High risk is 500, which I don't think we'll get in a while.

IT WILL COLLAPSEIt will all collapse. UNH was down -25% and -18% on the day like a week ago. The thing will collapse and so will the american stock market.

UNH | Catching the Fall Risky Play💊 Oversold Swing Play
⚠️ Risk Factor
You're not trading a bounce—you’re stepping into a fire. Legal risk + uncertainty = extreme volatility. However, if markets stabilize, UNH could deliver a powerful mean-reversion move.
UnitedHealth ( NYSE:UNH ) is trading in panic territory after:
DOJ launched a criminal probe tied to Medicare Advantage billing
Abrupt CEO resignation
Suspended 2025 financial guidance, sparking investor selloff
Still, the fundamentals aren’t dead. Q1 revenue is strong, and long-term value is on the table.
🎯 Trade Plan
🟢 Entry Zones
🔹 Zone 1: $275–$285 → Technical support + RSI oversold
🔹 Zone 2: $255 → 2021 breakout retest
🔹 Zone 3: $225 → Ultimate fear zone (deep capitulation possible)
💰 Profit Targets
✅ TP1: $300 – Psychological level & minor resistance
✅ TP2: $340 – Gap-fill area & 50-day MA
✅ TP3: $385+ – Long-term value zone if sentiment reverses
📌 Final Word
UNH is no penny stock—it’s a $280B giant under siege. If you believe fear is overdone, this is a calculated shot at a rebound. Just keep your stops tight and your thesis tighter.
🚨 Disclaimer: This is not financial advice. Trading involves risk. Always DYOR and manage your exposure carefully.

Forget $342 more like $378This daily chart looks so primed to run hard all the way up to $378. It doesn’t get much better than this!!! The question is how soon will we smash through $342? If volume holds up, my guess is no later than May 23! This is only speculation and just for fun! Not financial advice so don’t go getting bent out of shape! 🙌

UnitedHealth (UNH) Share Price ReboundsUnitedHealth (UNH) Share Price Rebounds
A month ago, in our analysis of the UNH chart, we:
→ highlighted that UnitedHealth shares had lost nearly 23% in value;
→ drew a descending channel and suggested that bearish pressure could continue, threatening the support level around $450, which had held since early 2022.
Since then, UNH’s stock price decisively broke below that level (as marked by the arrow), falling to around $250 — its lowest point since spring 2020 — before staging a sharp rebound. This steep price movement was driven by a series of fundamental developments, including:
→ the resignation of the CEO and news of a Department of Justice investigation into potential Medicare fraud;
→ UnitedHealth withdrawing its earnings guidance for the coming year;
→ political debates over the Medicaid programme as part of the 2025 budget negotiations;
→ President Trump’s directive to cut prescription drug prices.
Recent news that the new CEO and several top executives have bought tens of millions of dollars’ worth of UNH shares appears to have renewed investor confidence — the share price rose above the $300 mark yesterday.
Technical Analysis of UNH Share Chart
These latest developments justify an update to the descending channel configuration. Of particular note is the gradual decline with limited volatility — a sign that the price is moving along the channel's median line (highlighted on the chart).
In this setup:
→ the bounce from the $250 level points to the lower boundary of the channel;
→ traders may consider a scenario where the current recovery pushes UnitedHealth stock towards the median, after which supply pressure may return and offset the recent dominance of demand.
It’s also possible that the key psychological level of $300 could now act as support.
This article represents the opinion of the Companies operating under the FXOpen brand only. It is not to be construed as an offer, solicitation, or recommendation with respect to products and services provided by the Companies operating under the FXOpen brand, nor is it to be considered financial advice.

Is $340 the next stop??Maybe we touch $342 as early as this week. It looks like it has the momentum to get there. All speculation so don’t get a bent out of shape. This is simply for fun. What are your thoughts??

UNH: Short OTM puts expiring May 23UNH bounced from the $248.88 low and will probably not hit new low the following week. IV was relative high due to volatile stock price movement. Hence, setting up naked shorts on OTM puts.
Max potential profits: $1,000+ premiums on May 23
Exit strategy: buy back gradually if UNH price crosses down $240 to secure positive results; otherwise, close all on May 23
Instrument Entry Date
UNH 23MAY25 200P 2025-05-15
UNH 23MAY25 210P 2025-05-16
UNH 23MAY25 225P 2025-05-16
========== STATS ==========
Number of traded instruments YTD: 20
P/L YTD: $2K
Win rate: 100%

$UNH: With stock down more than 60%, is it in buy zone? NYSE:UNH with one after bad news lost 60% of its market cap from its ATH of 600$. NYSE:UNH the largest insurer in US has been in news for all the wrong reasons. The stock after losing 60% of the value has a dividend yield of 3.1% which is 2.5 times of the S&P Yield. The historical dividend growth of NYSE:UNH has been more than 8%. This makes NYSE:UNH a compelling story stock during the recent downturn. With recent insider buys of the NYSE:UNH stock most of the fundamental indicators indicate a positive outlook.
But what are the technical indicators telling us? Today we are looking at the historical chart of the stock. The last time the stock was down more than 60% was during the 2007-2008 Financial recession. In 2008 it did lose more than 64%. If we investigate the long term RSI then we see it below 25 which we also saw last during the Financial recession.
Verdict : Buy 1/3 @ 250, Buy 1/3 @ 275, Buy 1/3 now.
