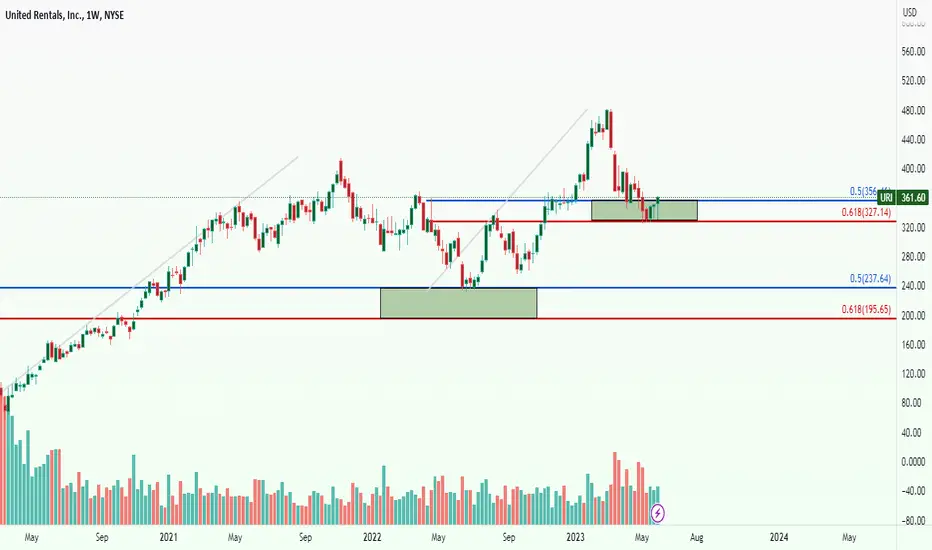
URI eyes on $671: proven Double Fib zone holding up new Highs URI should actually BENEFIT from Tariffs.
Currently testing a double fib at $671.16/30
Look for a Dip to a Break-n-Retest for entry.
URI trade ideas

URIan upward trend in the prices of an industry's stocks or the overall rise in broad market indices, characterized by high investor confidence

URI .. United Rentals is a sign of S&P Industrial peakMay seem complicated, but just sit and focus on the chart a bit.
The Williams vix bottom indicator is useful when matched with the MACD divergent indicator.
The Price ranges are each time the vix indicator and MACD divergent indicator flipped.... to show tops and bottoms.
But weird thing is the last "bottom" didnt display on the indicator, which means outside forces may of pushed up the markets for a certain day of electioning to come....meaning now that everything is settled and all is ready to be let go of....The rollover needs to be about 2x the fall of that, maybe more.
But notice how the averages on the MACD divergent indicator show a 101% handle which is right back to the 0 level....funny how that works if everything is random or whatnot.
So basically, SIJ if you care to think this market is a bit more broken than you could imagine.

$URI with a bullish outlook following its earnings #StocksThe PEAD projected a bullish outlook for NYSE:URI after a positive over reaction following its earnings release placing the stock in drift B with an expected accuracy of 90%.

We like when URI go upURI is printing higher highs and creating typical bullish pattern indicative of upwards momentum. Price is accumulating orders at demand zones and pushing up to discover new supply zones.
Going to pick some more up for the portfolio at these levels to ensure I remain diversified in the markets.

URI heads up at $675: major fib confluence, possible local topURI heads up at $675: major fib confluence, possible local top.
The exact zone defined by the fib confluence is 671.30 - 677.71
Look for a pullback there, or a break and retest for continuation.
Will post updates as price action hits key levels.
=========================================================

uri making wavesIs at the point when a reversal is possible. I believe 700 is possible from here. A lot of room to run on RSI, MACD, and Stochastics. Ready to bounce off bottom band.

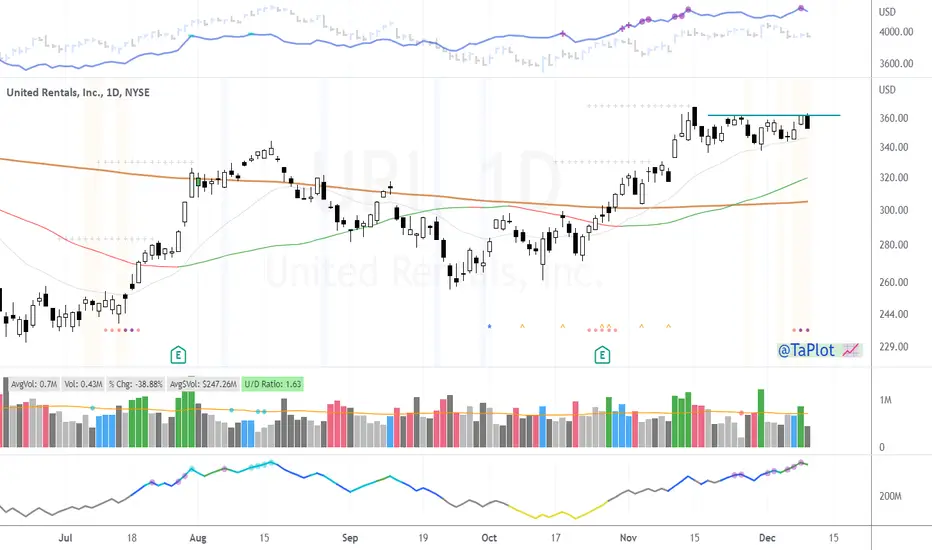
United Rentals Has Pulled BackUnited Rentals has trended higher since October, and some traders may see opportunities in its current pullback.
The first pattern on today’s chart is the rally to new highs on January 25 after earnings beat expectations. The industrial stock has held that move without a significant retracement, which may suggest that buyers outnumber sellers.
Second is the falling trendline since March 4. URI is now challenging that short-term resistance.
Third is the series of higher weekly lows since the beginning of February.
Next, prices have pulled back to hold the 21-day exponential moving average (EMA). The 8-day EMA is also above the 21-day EMA. Those patterns may reflect an uptrend.
Finally, the February 12 close of $663.53 was resistance through the end of the following week. URI has pulled back to form a hammer candlestick at the same level. Has old resistance become new support?
TradeStation has, for decades, advanced the trading industry, providing access to stocks, options and futures. See our Overview for more.
Past performance, whether actual or indicated by historical tests of strategies, is no guarantee of future performance or success. There is a possibility that you may sustain a loss equal to or greater than your entire investment regardless of which asset class you trade (equities, options or futures); therefore, you should not invest or risk money that you cannot afford to lose. Online trading is not suitable for all investors. View the document titled Characteristics and Risks of Standardized Options at www.TradeStation.com . Before trading any asset class, customers must read the relevant risk disclosure statements on www.TradeStation.com . System access and trade placement and execution may be delayed or fail due to market volatility and volume, quote delays, system and software errors, Internet traffic, outages and other factors.
Securities and futures trading is offered to self-directed customers by TradeStation Securities, Inc., a broker-dealer registered with the Securities and Exchange Commission and a futures commission merchant licensed with the Commodity Futures Trading Commission). TradeStation Securities is a member of the Financial Industry Regulatory Authority, the National Futures Association, and a number of exchanges.
TradeStation Securities, Inc. and TradeStation Technologies, Inc. are each wholly owned subsidiaries of TradeStation Group, Inc., both operating, and providing products and services, under the TradeStation brand and trademark. When applying for, or purchasing, accounts, subscriptions, products and services, it is important that you know which company you will be dealing with. Visit www.TradeStation.com for further important information explaining what this means.

URI ( United Rentals Swing Trade target from Dec 22 2023Here is what I see on URI United Rentals Test 2 completed

$URI - Which is it?NYSE:URI is showing some weakness with negative divergence on both MACD and RSI. For the bulls, it looks like it is forming a cup and handle pattern. For the bears, it looks like a double top formation.
So, which is it? Here are the deciding factors:
If the price can break and close above $490, it could confirm the cup and handle breakout and the price could reach $552.
However, if the price breaks below $439, the double top pattern could play out and the price could fall to the $412 to $400 area.

URI ,,, Buy opportunity uptrend
It seems correction has been finished and I see a good bull candle as a trigger to purchase it.
Around 310 can be a good place for Sl.
United Rentals (URI): Stock is overbought and due for pullbackI am bullish on United Rentals (URI) for the long-term looking 3 to 5 years ahead.
The company has great fundamentals and is holding up well in this environment where we could see a recession in the U.S. in 2023.
URI just reported a positive Q4 earnings with a strong outlook.
The technicals show an overbought condition on the 1 day chart.
So, I am anticipating a decline in the stock which could be triggered by the Fed meeting on 1/31 & 2/1 depending on actions taken and what is said about future rate increases.
Action: wait for a decline, then buy
The link contains an article with a detailed discussion.

United Rentals ,,,, strong breakout Uptrend
It is a strong breakout of a top and my expectation is touching 590 .
Do not forget setting a good SL for it.

United Rentals: Where’s the Recession?Despite all the talk about a recession in 2023, many cyclical industrial companies have gained traction lately -- including United Rentals.
The first item on today’s chart is the $365 area where URI peaked in late March. Prices pushed against that level several times since mid-November while making higher lows. The result has been an ascending triangle. The stock broke out of that potentially bullish continuation pattern last week.
Next, the 50-day simple moving average (SMA) rose above the 200-day SMA in late November as the triangle formed. That kind of “golden cross” may suggest the longer-term trend is turning positive again.
Third, the 8-day exponential moving average (EMA) has remained above the 21-day EMA throughout the consolidation period. Such tight price action could indicate buyers exceed sellers.
Finally, MACD has just turned positive.
TradeStation has, for decades, advanced the trading industry, providing access to stocks, options, futures and cryptocurrencies. See our Overview for more.
Important Information
TradeStation Securities, Inc., TradeStation Crypto, Inc., and TradeStation Technologies, Inc. are each wholly owned subsidiaries of TradeStation Group, Inc., all operating, and providing products and services, under the TradeStation brand and trademark. TradeStation Crypto, Inc. offers to self-directed investors and traders cryptocurrency brokerage services. It is neither licensed with the SEC or the CFTC nor is it a Member of NFA. When applying for, or purchasing, accounts, subscriptions, products, and services, it is important that you know which company you will be dealing with. Please click here for further important information explaining what this means.
This content is for informational and educational purposes only. This is not a recommendation regarding any investment or investment strategy. Any opinions expressed herein are those of the author and do not represent the views or opinions of TradeStation or any of its affiliates.
Investing involves risks. Past performance, whether actual or indicated by historical tests of strategies, is no guarantee of future performance or success. There is a possibility that you may sustain a loss equal to or greater than your entire investment regardless of which asset class you trade (equities, options, futures, or digital assets); therefore, you should not invest or risk money that you cannot afford to lose. Before trading any asset class, first read the relevant risk disclosure statements on the Important Documents page, found here: www.tradestation.com .

$URI tight right side actionAnother one to keep an eye on is $URI as it tightens up very nicely on the right side of the chart.
Weekly chart looking constructive after breaking a multi month down trendline.
Daily OBV making multiple NHBP pointing to institution accumulation.
$URI with a Bullish outlook following its earnings #Stocks The PEAD projected a Bullish outlook for $URI after a Positive over reaction following its earnings release placing the stock in drift B with an expected accuracy of 88.89%.

UNITED RENTALS - BULLISH SCENARIOBounce back in the construction activity and huge amounts of federal infrastructure spending in the coming months are suggesting strong earnings for the sector and especially for United Rentals Inc, which is the largest equipment rental company in the world, serving its customers through an integrated network of over 1,100 rental locations in the U.S. and Canada.
From a technical point, we have a double bottom, with bullish RSI divergence and retest of the breakout.
The first strong resistance is located at 0.5 Fibonacci.
Risk Disclosure: Trading Foreign Exchange (Forex) and Contracts of Difference (CFD's) carries a high level of risk. By registering and signing up, any client affirms their understanding of their own personal accountability for all transactions performed within their account and recognizes the risks associated with trading on such markets and on such sites. Furthermore, one understands that the company carries zero influence over transactions, markets, and trading signals, therefore, cannot be held liable nor guarantee any profits or losses.

URI DailyNYSE:URI daily looks like a good buy. After a perfect double bottom it has now broken the top trendline and the 5 EMA has crossed above the 20 EMA.

URI getting ready to move higher!* Excellent earnings
* Very strong up trend
* High relative strength in the Industrials sector
* Breaking out of a ~8 month consolidation with very high volume (172.64% higher than average)
* Max probable ROI on this trade is 26.08%
Note:
* Institutions don't buy breakouts, they create breakouts.
Trade Idea:
* Now is the perfect time to get in since the price is still very close to the broken level and it broke out on very high volume.
* Also, the last closing candle can be classified as a bullish pin bar showing tonnes of demand under the $364.30 area


United Rentals will be beneficiary of Stimulus talks & Stimulus$URI. One word: Stimulus.
BUY signal, 7 confirms, and bouncing off .618 Fibonacci retracement.
Buy stock or long-term options.
Stop loss is $260, b/c YTD it's up 92%.
Happy Trading, from CJ -- aka the greatest FURU.
To find out more about The Ultimate Stock Indicator on Tradingview, please check my public profile.

$URI - Updated Wave Count
Jan 11 Update:
- Had nice entry on the pull back to support at 224 on Jan 24 and then had a nice GAP up
- Hit our 2.272% target and just under the 1.615%
- slight retrace flagging down to the 0.382 which is close to my 38.2% wave 4 bottom. Is this the wave 4?
Trade Entry Options were:
Entry Option 1 - Breakout: $234.50
Entry Option 2 - Pull Back: $225-226 or $227-$230
Stop: $224
Targets: 245, 273, 288, 307

$URI Awaiting Breakout In United Rentals.
URI had recently broken to new highs but was hindered by the
most recent decline in the markets.
URI is for sure a election play, with infrastructure spending used to woo voters.
Its also benefits from the thriving Housing market.
The commodities surge also signals growth ahead.
Local Fibonacci price targets as per the chart, with 3 particular levels of interest.
Looks like a Bull-Flag is forming, a break out from that structure show see buyers.
