Visa shortit is close to mm200 and triangle side with high volumes, in my opinion there have been a lot of profit taking
I sell with target Gap at 196-197
V trade ideas

V Visa exposure to Russia and UkraineVisa and Mastercard restricted transactions in Russia as aggressive penalties on the country over the invasion of Ukraine.
Around $1.2 billion of Visa Inc.’s annual net revenue comes from Russia and Ukraine.
4% of Visa’s total net revenue comes from Russia and about 1% from Ukraine.
In this case, my price target for the stock is the $187 resistance, while the sell-off area could touch $174 - $183.

VISAGreat 3rd quarter = bullish move for VISA.
The daily showed a double bottom and possible close at 61.8 before continuing to the upside today.


Visa Expected earnings Visa should reach around 200 to 210 in the up coming weeks and could reach the limit line in the next year
Trading price
EMA crossed again and the trend is upward.
Bellow
New Press Release:
Visa and Thunes Expand Visa Direct’s Reach to 1.5 Billion Digital Wallets
Also, There is alot more news that support V going BULLISH.
Current
190.37 USD

The 3 Easiest Indicators To Look For Before Buying A StockIn This video wee are going to talk about "The 3 Easiest Indicators To Look For Before Buying A Stock"
This company has partner with 2 big companies in the industry,
in this video you will see which these big industry giants are.
You need to understanding the following:
#1 The stock is hidden with powerful clues for you
#2 You can watch out for these clues before you buy
#3 Always be sensitive to what the breaking news says
Once you understand what we discuss in this video you
will be more likely to trade safely and make profit this coming week
Watch this video now before this opportunity to make profit this coming week goes.
Cheers.

Global Crash As per Global sentiments & war like activities maket making swing lows.
Keep bagpacks ready to invest in discounted price 🤗

V bearish 10 ema playSMALLLLL BULL Candle closing below the10 ema. V had a retest on the weekly chart. Trend is bearish. BIG breakout of a triangle and closed below the 200 sma on a weekly.

V daily bullish hammerOrder BUY V NYSE Stop 180.58 LMT 180.58 will be automatically canceled at 20230101 00:00:00 EST
V daily bullish hammer in oversold area if hold within a channel will move up.

VISA WEEKLY AnalysisHello ladies and gentlemen, according to my graphical analysis of Visa Stock, there is a high probability of a decline towards the 159$ level in the next few weeks!

V trade idea 03Oct2022Thesis:
Visa look really bearish lol. Looked for quite a while for some sort of reason for this to potentially go up, but based on current chart sellers are in complete control.
3 inside bars, so price is nice and wound up. Should be good volatility down out of this range.
Looks like a good setup for a scalp or swing, pick your poison. No sign of life from bulls here, just pay attention to the day they finally step in.
I'll likely scalp.
My personal put entry based on 2 given scenarios. GLTA NYSE:V

Visa Looking to Loose More Ground. A nice looking zigzag appears to be forming on this one, with what I believe is a completed B Wave triangle. The picture is supported by momentum reversal as well.
We are not in the business of getting every prediction right, no one ever does and that is not the aim of the game. The Fibonacci targets are highlighted in purple with invalidation in red. Confirmation level, where relevant, is a pink dotted, finite line. Fibonacci goals, it is prudent to suggest, are nothing more than mere fractally evident and therefore statistically likely levels that the market will go to. Having said that, the market will always do what it wants and always has a mind of its own. Therefore, none of this is financial advice, so do your own research and rely only on your own analysis. Trading is a true one man sport. Good luck out there and stay safe.

Visa Levelling Up. VFinal leg of upgoing zigzag. B wave confirms both end of B downtrend and a beginning of a final impulse up. Cleared 0.618 with no overbought, nor divergences, taking 1.0 as the next best level of potential resistance, after that a very common 1.2.
We are not in the business of getting every prediction right, no one ever does and that is not the aim of the game. The Fibonacci targets are highlighted in purple with invalidation in red. Confirmation level, where relevant, is a pink dotted, finite line. Fibonacci goals, it is prudent to suggest, are nothing more than mere fractally evident and therefore statistically likely levels that the market will go to. Having said that, the market will always do what it wants and always has a mind of its own. Therefore, none of this is financial advice, so do your own research and rely only on your own analysis. Trading is a true one man sport. Good luck out there and stay safe.

V at critical support, can it hold ❔☘must bounce here if we want to see a bounce, at RSI/trend and extreme support. this is the definition of a cluster support area! lol
watching for longs over 185.91, shorts below 179.10 💯

Visa (V) - When and where to long (or short!)V (Visa) is making corrective moves along with overall market. Assuming we "bounce" and don't go into a full blown recession this is a concrete trading idea for when to go long. While V could arguably correct from here at the 618, I believe we are in for further downside. Targeting the 786 retrace of the latest swing makes sense.
Why take it this? Excellent reversal idea with solid risk to reward. (1:3 TP1 and 1:4 TP2)
Entry: 192.45 - Long from longer term support zone and when market conditions look favorable for a bounce
Stop loss: 184.7 - Lower low (market structure continues with the LL LH path, idea is invalidated)
TP1: 217.6 - s/r level
TP2: 224 - s/r level
PS... Since I expect a reaction here at the 618 ($198), if you wish to short you can enter short off the psychological $200 level (0.5 fib) back down to the long entry target. I would argue this trades with current trend direction even better but I know how psychologically many have a hard time shorting.
Zoomed out view of setup

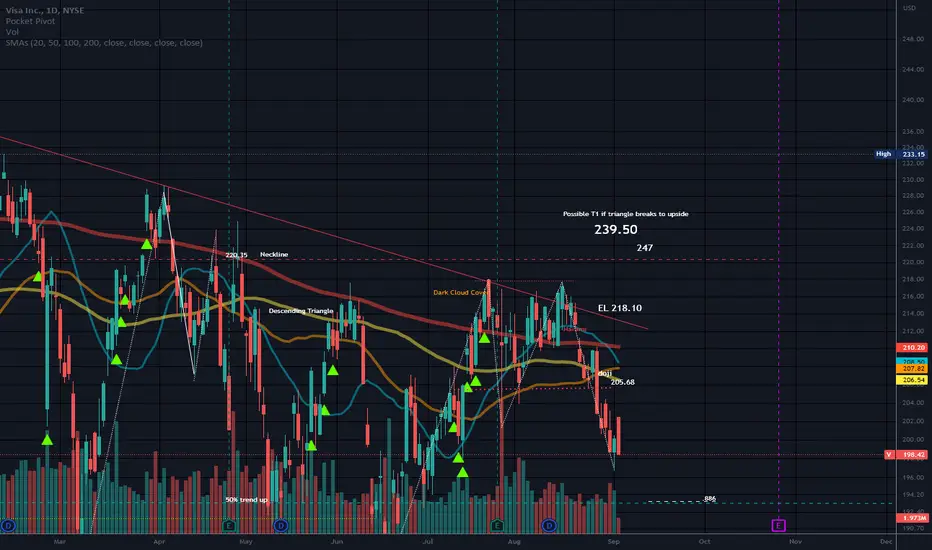
Descending TrianglePrice appears to be in a large Descending Triangle.
Neutral pattern until a trendline is broken.
Prior Head and Shoulders pattern.
Targets in orange below price are for a break of support of the triangle.
There is a Double bottom at the support line of the triangle.
Possible M structure forming. It is too early to tell.
Gaps noted below support line.
Price is still above the 50% level of the trend up measured from the Flu low.
No recommendation.
MA's chart is similar.
VISA About to start a historic Bull Cycle similar to post 2009This is Visa Inc. (V) on the 1W time-frame. The primary pattern since the July 26 2021 All Time High (ATH) has been a Falling Wedge and the price continues to hold that formation after being rejected on the August 15 candle on the Lower Highs (top) trend-line. With the 1W MA50 (blue trend-line) crossing below the 1D MA100 (green trend-line), the first Bearish Cross since March 14 2011 has been formed!
In fact that Bearish Cross capped off a similar trading pattern to that Visa has been trading in since mid 2019. This idea compared the two eras: 2019 - 2022 and 2008 - 2011.
In 2011, the stock was trading within a Channel Down as the accumulation pattern instead of a Falling Wedge, with its Lows contained around the 0.5 Fibonacci retracement level. Following the Bearish Cross and the pull-back that came with it, the price made one last Lower High, pulled-back and then broke above the pattern aggressively. If the same formation continues to be repeated then we can have a break above the Falling Wedge by December/ January. See also how the RSI and MACD patterns are similar.
--------------------------------------------------------------------------------------------------------
** Please support this idea with your likes and comments, it is the best way to keep it relevant and support me. **
--------------------------------------------------------------------------------------------------------

Huge Move INCOMING (soon)This massive 208 day long ( at the time of this making ) Triangle / Pennant structure could pay VERY well.
- 186 is a key support level

Visa USA SSI Live Trading Series
Sun Storm Investment Trading Desk & NexGen Wealth Management Service Present's
Focus: Worldwide
By Sun Storm Investment Research & NexGen Wealth Management Service
A Profit & Solutions Strategy & Research
Trading | Investment | Stocks | ETF | Mutual Funds | Crypto | Bonds | Options | Dividend | Futures |
USA | Canada | UK | Germany | France | Italy | Rest of Europe | Mexico | India
Disclaimer: Sun Storm Investment and NexGen are not registered financial advisors, so please do your own research before trading & investing anything. This is information is for only research purposes not for actual trading & investing decision.
#debadipb #profitsolutions

V loses iti think momentum takes V to sub the yellow level, 100s. Lower levels marked for the fall, does certainly have strong support, stronger than most, but wont be immune to the market collaps. longer term on the upside, if we break the blue we make new highs its moonshot

V IS ABOUT TO TEST 190 AGAINTicker Symbol: $V
️Timeframe: DAY
️BREAK OF RISING WEDGE AND INSIDE DESCENDING CHANNEL
️Investment Strategy: SHORT
TECHNICAL ANALYSIS:
MONEY MOVEMENT SHIFTING DOWN AND RED DOT: BEARISH
RISING WEDGE BROKEN, MIGHT SEE 190 AGAIN. (BEARISH)
DESCENDING TRIANGLE CHANNEL: BEARISH
Follow for daily stock, crypto and forex technical analysis.
Trading is risky, and I understand nothing is guaranteed. Proper risk management should be in place at all times to minimize losses. Please consult a financial advisor before trading. All Inclusive Trading LLC is not a financial advisor and may not be held liable for any losses which may occur.

V: Who is going to win, BULLS OR BEARS?? Ticker Symbol: $V
Strategy: Neutral until break either side on Rising wedge
Time Frame: 4HR
TRENDSI ATS: BEARISH (RED DOT WITH RED LINE)
RSI Technical: Bearish.
$V is making Descending Triangle Pattern, which is Bearish. Also, formation of Rising Wedge in last couple of weeks, that is Bearish as well.
I am still NEUTRAL, until I see breakout confirmation on either side.
Follow for daily stock, crypto and forex technical analysis.
⚠️ Trading is risky, and I understand nothing is guaranteed. Proper risk management should be in place at all times to minimize losses. Please consult a financial advisor before trading. All Inclusive Trading LLC is not a financial advisor and may not be held liable for any losses which may occur.

Doji Candlestick Menaces VisaVisa has trended steadily lower for the past year, and now some patterns may suggest that another peak has formed.
The first item on today’s chart is the attempted rally on July 27 following better-than-expected earnings. It looked like V could stay green for about half the day, but then it knifed down on heavy volume. The resulting higher high and lower low produced not only a large outside day but also a doji candlestick. That’s a potential bearish reversal pattern. (In addition, it left a hanging man candlestick on the weekly chart.)
Next, the potentially bearish price action occurred near a declining trendline that began in February.
Third, MACD is nearing a potential bearish crossover.
Finally, the 200-day simple moving average (SMA) has been falling. Also notice how V has struggled to remain above it since gapping downward in late October. Has the longer-term trend turned lower?
TradeStation has, for decades, advanced the trading industry, providing access to stocks, options, futures and cryptocurrencies. See our Overview for more.
Important Information
TradeStation Securities, Inc., TradeStation Crypto, Inc., and TradeStation Technologies, Inc. are each wholly owned subsidiaries of TradeStation Group, Inc., all operating, and providing products and services, under the TradeStation brand and trademark. You Can Trade, Inc. is also a wholly owned subsidiary of TradeStation Group, Inc., operating under its own brand and trademarks. TradeStation Crypto, Inc. offers to self-directed investors and traders cryptocurrency brokerage services. It is neither licensed with the SEC or the CFTC nor is it a Member of NFA. When applying for, or purchasing, accounts, subscriptions, products, and services, it is important that you know which company you will be dealing with. Please click here for further important information explaining what this means.
This content is for informational and educational purposes only. This is not a recommendation regarding any investment or investment strategy. Any opinions expressed herein are those of the author and do not represent the views or opinions of TradeStation or any of its affiliates.
Investing in cryptocurrencies involves significant risks. Please click here for TradeStation Crypto’s risk disclosures on investing and trading in cryptocurrencies.
Investing involves risks. Past performance, whether actual or indicated by historical tests of strategies, is no guarantee of future performance or success. There is a possibility that you may sustain a loss equal to or greater than your entire investment regardless of which asset class you trade (equities, options, futures, or digital assets); therefore, you should not invest or risk money that you cannot afford to lose. Before trading any asset class, first read the relevant risk disclosure statements on the Important Documents page, found here: www.tradestation.com .
