V trade ideas

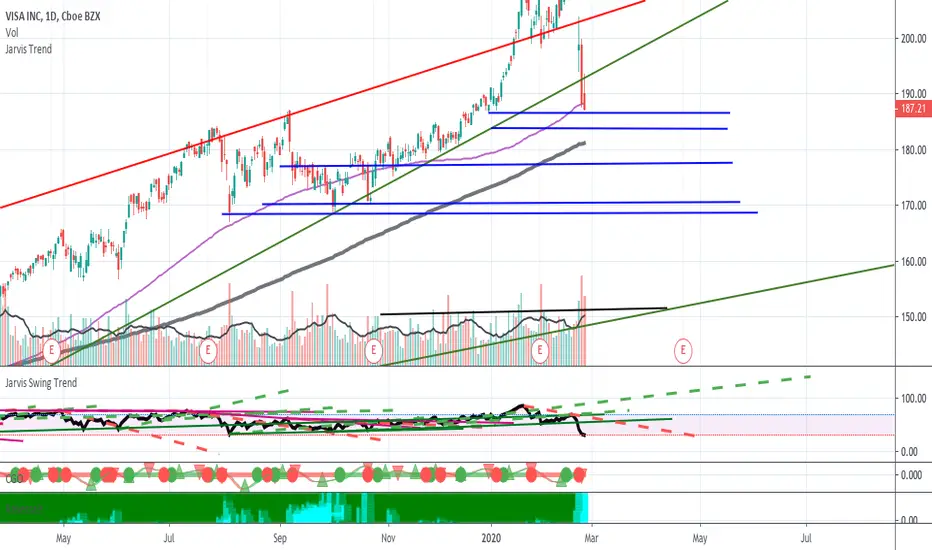
VISA Hidden Bullish Divergencehidden bullish divergence, a situation in which the oscillator produces a lower low while price maintains a higher low. Visa is a very consistent stock and has produced some great returns.. Very nice opportunity for a long entry if you don't believe in cryptocurrency's power ;) Currently sitting on grey EMA.

$V - Visa golden gap down 200D bouncePerfect Visa open placement here. Gap above starts to fill and still a good starter long entry. 200d does not continue its bounce and fails is a good down signal.

Visa update with buy opportunityHey all,
im long in VISA and have been in it for a year ( SwingTrading )
Visa have been in a up trend since the lunch in 2008, and it have been holding the 50 / 100 MA PERFECTLY for many years ( unbeliveable )
Visa er a healthy business and i think it have a lot in it then it shows ( fundamental analysis is very positiv )
link to visa earnings : investor.visa.com
I have put in a green line, to show where the FIBO retrancement 0,681 ends.
The plus side here is it just on the support line and could mean a posible new buy pos ( but we have to bare in mind the china VIRUS can have a small impacted on all stocks )
so we have to be carefull befor making the buy ( lets see if it holds the support line on monday ) or will it go down to the 50 MA line.
lets see what happens
your more then welcome to reply and share your thoughts
( This is not an investment advice - always remember to do your own reseach )

$SPY $V $V VISA Long term view to the top of the fib retracement. Any thoughts? Does this look right to anyone? Im long I want 230 250

V Symmetrical TriangleV gained momentum in January as it announced new displacement technology for 2020. The stock has a Professional Trader setup for triggering High Frequency Trader algorithms, which ran the stock up with momentum. Profit taking quickly halted the run temporarily with a gap down. Smaller Funds VWAPs triggered on the Buy on the Dip, which created another 4 days of profit taking.

Optimistic and conservative outlooks for the short-termPole of the flag forming at $191.92, breakout point at $203.94.
Conservative price target: $208.91
Optimistic price target: $219.92

Correction for Visa. Current price and wave analysis suggest that the stock has completed its 3 red wave upon rejecting the expansion level at 200.0%, a strong 3rd wave indeed. Current price action suggest that Visa is on the 4 th corrective wave and it is forming a strong bullish flag. Target rebound should be near the demand level 1 highlighted in the chart .

[Long] VSimilar to AMD and the rest of the tech sector, this bull flag could resolve very bullish.
We are likely witnessing a parabolic blow off top, risk manage carefully.


Visa to break north from the flagFundamentals and weekly trend indicates V is a buy every time it dips or consolidates - looking to market on a red open and hold for $220/s
will close if daily RSI dips under 50

this one is beautiful reports next week lets see what they will say.
the company is amazing and soon will enter full power to china after signing the first phase of the trade war with China.

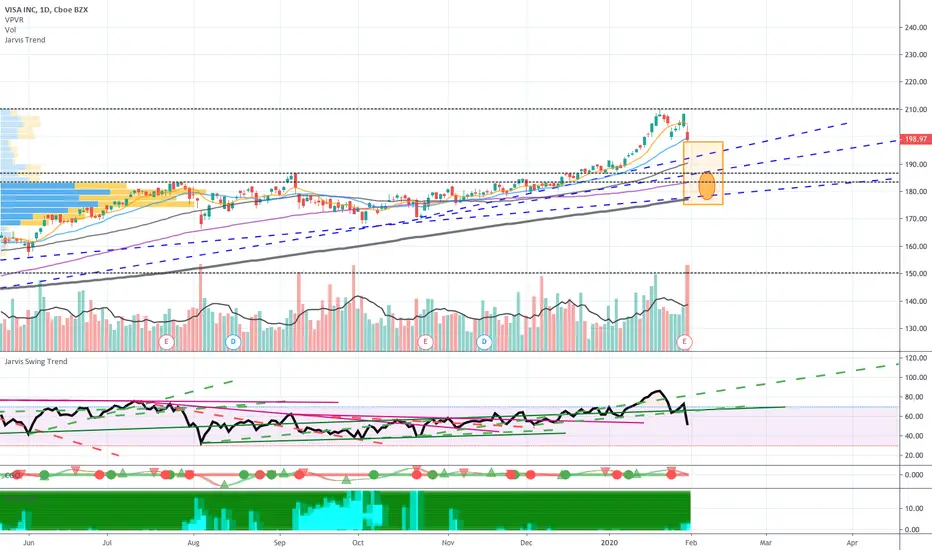
I already have 60% position. [2022 205 calls]40% I would be buying in that rectangle ( eclipse is major demand area).
WWAAAYYYY OVERSOLDThe market brought everything down today. Looking good to play quick daytrade or swing for Monday-Tuesday and expect a lot of buyers during the premarket.

Buy medium term with VisaMy strategy is to combine several techniques at once:
+ Price channel and trend line: help me identify the direction of the price,
+ Supply - demand: help me identify the reversal position,
+ Elliott wave: help me determine the cycle of price,
+ Candlestick pattern and price action: Help me correct the position to the order.
...

VISA channel intact
Bullish into earnings.
Long term channel intact.
Earnings will need to great to break out to the upside.
Cashless society major catalyst for the stock long term.

V - Buy weekly puts, 1-2 day trade, low riskVisa reports on 1/30 after market close - this is a follow up to my original trade idea (linked chart)
I bought 200 puts, even 202.50 is a good strike.
Risk is low - exits: if 30m candle closes over 204, more conservatively if 30m candle closes over recent high 203.64.
On 30min chart the stochastic make a sharp move down, which usually leads RSI. RSI tested 50 and dipped below again - this bounce is a strong indicator.
Candle patterns are bearish and there is resistance here against cloud.
Above indications support another move down - otherwise RSI will cross back over 50 and trade is closed.

V - open weekly 200 puts - close before 1/30 earningsI bought 1/31 expiry 200 strike puts at $1.65. Reasons for trade:
1) 60min chart - 20sma in downtrend, 10sma below 20, and RSI still under 50.
2) daily chart - stock retesting up against 10sma.
3) 30min chart - RSI needs to stay below 50, and I am looking for %K stochastic to drop below RSI again, as confirmation of my trade.
4) Risk is low - exit on trade over 203.74, recent 60 min high. Risk goes up if stock opens much higher Wed, so keep trade size small.
5) Reward is high - if price hovers in this area IV will raise option value. If stock drops (see chart) option value gains at least 50%.
*** Close this position before earnings on 1/30 (after market close)

V headed to rejoin former channel after earningsAssuming a favorable earnings report, Visa will rise up to it's former channel and will resume its travel along those lines for a few months.


Visa Psychological Resistance 200Possible psychological resistance at $200 a share, wouldn't recommend shorting this as this is a very consistent stock, providing steady returns, however it will be interesting to see what occurs once price has broken the $200 milestone. Also sitting at top of regression trend, which may lead to a small pullback

VISA - busting out nicely.V busting out nicely. Climbing continues out of the channel. Nice rise for 18+% gains in 3 month span. REVISED UPWARD PRICE TARGETS ------ AS FOLLOWS: VISA's average price target is $215.54..... with a high forecast of $233.00, and a low forecast of $194.00
