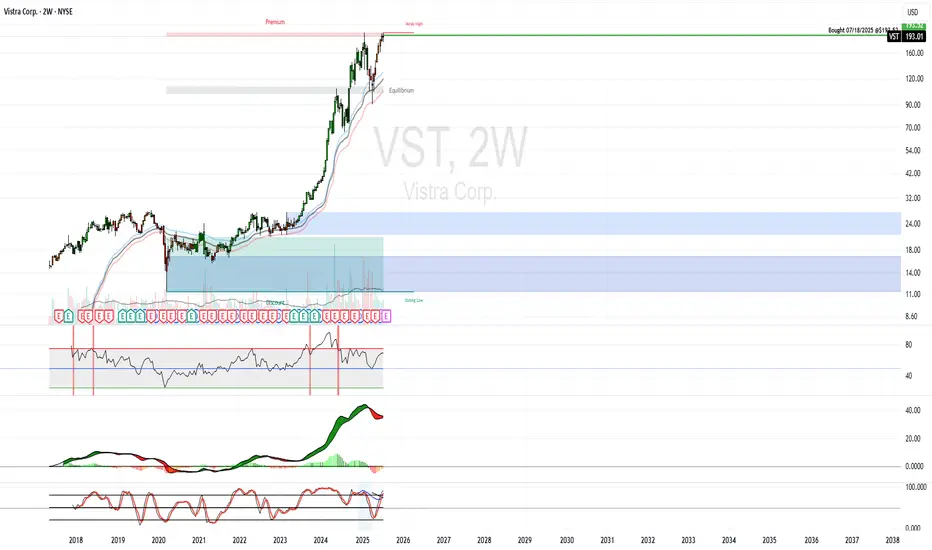
VST Purchase - Nuclear ThemeVistra Corp. (VST) – Cash Flow Machine
$4.09B TTM operating cash flow, highest among peers 2.
Strong nuclear and renewables mix, with AI data center exposure.
Thesis: Balanced growth and income play with upside from AI-driven demand.
Purchased CEG earlier. AI megatrend is tied to nuclear.
Not stoked about the purchase price, but long term growth should overcome any short term volatility. Also, not excited about the GreenBlue rank, we will see if it continues to improve.
Other Nuclear stocks on my radar:
VST
CEG
GEV
TLN
SMR
GreenBlue Rank: 1055 / 2500
GreenRed Rank: 143 / 3147
VST trade ideas
VST trendlinestill within the channel but broke below 9 sma, staying long as long as it stays within the channel, exit / short of it breaks the lower line.
NFA

VST Weekly Analysis Summary (2025-04-16)VST Weekly Analysis Summary (2025-04-16)
Below is a consolidated analysis synthesizing the key points from all the model reports:
──────────────────────────────
Comprehensive Summary of Each Model’s Key Points
• Grok/xAI Report
– Technicals on 5‑minute and daily charts show price holding above key EMAs with a bullish MACD and neutral‐to‐moderately overbought RSI.
– Bollinger analysis finds price near the upper band on M5, hinting at some short‑term resistance.
– News and falling VIX support a moderately bullish stance.
– From the options chain, the $120 call (Ask $0.82) stands out due to high liquidity (5,481 OI) and moderate distance from the current price.
• Claude/Anthropic Report
– Daily and intraday indicators (EMAs, RSI, and MACD) support short‑term bullish momentum with price positioned above key moving averages and support.
– Relatively high open interest in the $120 call reinforces trader interest despite max pain at $115.00.
– Despite some headwinds (high volatility from VIX), the recommended play is a moderately bullish call trade.
• Gemini/Google Report
– Confirms price action above major M5 EMAs and recovering daily charts reinforcing bullish momentum.
– Highlights that although max pain at $115.00 and heavy OI at $120 could introduce trade friction, short‑term momentum supports a call play.
– Recommends a naked call trade using the $120 strike—even if its premium ($0.82) sits slightly outside the “ideal” range—given the risk/reward balance.
• Llama/Meta Report
– Mixed signals emerge: the 5‑minute chart shows some overbought tendencies and a bullish MACD, while the daily MACD is less convincingly bullish.
– A bearish angle is noted (via max pain and alternative put analysis), yet this view is in the minority.
– Although it suggests a potential put play at $112, most models discount this given the broader bullish momentum indicated by technicals and sentiment.
• DeepSeek Report
– Emphasizes bullish technical momentum on both the daily and intraday charts (price above EMAs, bullish MACD, and neutral‑to‑positive RSI).
– Falls in line with the other bullish reports despite noting that max pain at $115.00 might pin prices.
– Also supports the liquid $120 call option based on a favorable risk/reward trade setup.
──────────────────────────────
2. Areas of Agreement and Disagreement Between Models
• Agreements:
– The majority of the reports note that the price remains above key short‑term moving averages and shows bullish MACD momentum.
– All models acknowledge the high open interest and liquidity in the $120 call options.
– There is consensus that the VST overall outlook is “moderately bullish” in the current weekly cycle, supported by positive news catalysts and a falling VIX.
• Disagreements:
– While four reports lean toward a bullish call play, one (Llama/Meta) introduces a contrarian view by suggesting a put option trade due to concerns about max pain and slight overbought conditions on the M5 graph.
– The divergence is mainly in risk appetite and emphasis on short‐term technical extremes versus broader bullish momentum signals.
– As a result, while one model weighs in on a bearish possibility via puts, the majority support a call-based strategy.
──────────────────────────────
3. Clear Conclusion
Overall Market Direction Consensus:
The aggregated signals point to a moderately bullish short‑term outlook for VST. Although max pain at $115.00 and high volatility temper the enthusiasm, the combination of price action above key EMAs, bullish MACD indications, positive news flow, and heavy call open interest overall favors a call trade.
Recommended Trade:
Based on the consensus, the recommendation is to BUY a single‑leg, naked call option.
Trade Parameters:
– Instrument: VST weekly options (Expiration: 2025‑04‑17)
– Strike: $120.00 call
– Option Premium at Entry: Approximately $0.82 per contract
– Trade Strategy: Long naked call
– Entry Timing: Enter at market open
– Profit Target: Approximately a 50% gain on the premium (target around $1.23 per contract)
– Stop-Loss: Roughly 20% below the entry premium (near $0.66 per contract)
Confidence Level in the Recommendation: ~70%
Key Risks and Considerations:
– The option premium is a bit higher than the ideal $0.30–$0.60 range, though justified by liquidity and risk/reward.
– High VIX levels imply elevated volatility; sudden reversals or wide swings can affect the trade.
– The max pain level at $115.00 could apply downward pressure, so an intraday loss cut is essential if price momentum stalls or reverses.
– Given the short lifespan (weekly expiry), theta decay is significant; close monitoring at open is critical.
──────────────────────────────
TRADE_DETAILS (JSON Format)
{
"instrument": "VST",
"direction": "call",
"strike": 120.00,
"expiry": "2025-04-17",
"confidence": 0.70,
"profit_target": 1.23,
"stop_loss": 0.66,
"size": 1,
"entry_price": 0.82,
"entry_timing": "open"
}

OptionsMastery: Looking at a H&S on VST! 🔉Sound on!🔉
📣Make sure to watch fullscreen!📣
Thank you as always for watching my videos. I hope that you learned something very educational! Please feel free to like, share, and comment on this post. Remember only risk what you are willing to lose. Trading is very risky but it can change your life!

VST good time to accumulatePower industry stock have been beaten down. Tariff wont change the need for power significantly, on the contrary local manufacturing will increase the demand for power. This is my personal opinion and no way any advise to invest

3/10/25 - $vst - I'm in.3/10/25 :: VROCKSTAR :: NYSE:VST
I'm in.
- as we rearrange chairs on the titanic
- i am actively finding the chairs already generating >5% fcf yield (ideally closer to 10%), growing, not having missed, good charts, mgmt etc.
- think i have a portfolio of 20-25 of these. trying to trim down to 10-15 and make them 1.5-2.5% positions each with my core positions remaining NXT leaps and OBTC
- b/c at this stage, if you're thinking we have substantial downside on risk, i think you're listening to too much CNBC
- this has been an asymmetric crash, so you won't see it in the index
- find your chairs, we may chop around for a few weeks, months... so i like stuff w good downside protection and that's super rentable for income (back to why i'm adding this)
whatchu think anon?
so far the rental portfolio includes
- gamb (2%)
- can (1.5%)
- vst (1.5%)
- blde (1.5%)
V

Vistra May Have Shaken Off DeepSeek Vistra fell in January because of DeepSeek. It quickly rebounded and now some traders may expect its longer-term uptrend to continue.
The first pattern on today’s chart is the rally between the low of January 27 and the high of January 30. The nuclear-power company has held above a 50 percent retracement of that bounce, which may confirm buyers remain in charge.
Second, a pair of inside weeks may also reflect a lack of selling pressure.
Third, prices have pushed against a falling trendline. Could that help confirm a breakout?
VST’s 8-day exponential moving average (EMA) also stayed above its 21-day EMA despite the DeepSeek crash. Price have additionally held their 50-day simple moving average. Those patterns may be consistent with short- and intermediate-term uptrends.
Next, the most recent set of weekly lows around $132 were above the September 30 trough near $115. Those higher bases may also reflect bullishness over the longer run.
Finally, traders may see potential AI catalysts on the horizon with Nvidia reporting on February 26, followed by its big AI conference March 17-21.
TradeStation has, for decades, advanced the trading industry, providing access to stocks, options and futures. If you're born to trade, we could be for you. See our Overview for more.
Past performance, whether actual or indicated by historical tests of strategies, is no guarantee of future performance or success. There is a possibility that you may sustain a loss equal to or greater than your entire investment regardless of which asset class you trade (equities, options or futures); therefore, you should not invest or risk money that you cannot afford to lose. Online trading is not suitable for all investors. View the document titled Characteristics and Risks of Standardized Options at www.TradeStation.com . Before trading any asset class, customers must read the relevant risk disclosure statements on www.TradeStation.com . System access and trade placement and execution may be delayed or fail due to market volatility and volume, quote delays, system and software errors, Internet traffic, outages and other factors.
Securities and futures trading is offered to self-directed customers by TradeStation Securities, Inc., a broker-dealer registered with the Securities and Exchange Commission and a futures commission merchant licensed with the Commodity Futures Trading Commission). TradeStation Securities is a member of the Financial Industry Regulatory Authority, the National Futures Association, and a number of exchanges.
TradeStation Securities, Inc. and TradeStation Technologies, Inc. are each wholly owned subsidiaries of TradeStation Group, Inc., both operating, and providing products and services, under the TradeStation brand and trademark. When applying for, or purchasing, accounts, subscriptions, products and services, it is important that you know which company you will be dealing with. Visit www.TradeStation.com for further important information explaining what this means.

Understanding trend cycles using Fibs and date ranges.NYSE:VST
Late night charting session doing what I do best.
2:55am

VistraVistra could be worth considering for traders who like volatility and the potential for price movement. The recent drop might set up a solid swing trade if the technical indicators and market sentiment line up. With its recovery potential, Vistra could be a good play for those looking to trade around key technical levels, but of course, managing risk is crucial.

H5 Trade of the Week! Nancy Pelosi SpecialTrade of the Week: NYSE:VST
Nancy Pelosi hype will return!
In this video, we cover:
🔍 In-Depth Trade Idea Breakdown
🎯 Precise Trade Execution
💰 Profit-Maximizing Tips
Don't miss out, friends! Watch now 👇
Not financial advice

Volume is king!If you are a trader not paying attention to Volume, it's time to reset.
This indicator that I built and described in this video will help you.

Vistra Corporation (VST) AnalysisCompany Overview:
Vistra Corporation NYSE:VST is a prominent U.S. integrated power company, combining retail and wholesale energy services. The company is actively transitioning toward renewable energy while maintaining a balanced portfolio with its conventional energy assets. Vistra's commitment to sustainability is reflected in the recent development of solar projects, positioning it well for the future of energy.
Key Growth Drivers
Renewable Energy Expansion:
Large Solar Projects in Illinois: Vistra's recent connection of two significant solar projects underscores its push to diversify into clean energy. This not only aligns with consumer demand for green energy but also supports regulatory trends favoring sustainability.
Strategic Diversification: By enhancing its portfolio with renewables, Vistra is positioning itself as a leading player in the transition to cleaner energy sources.
Operational Adaptability with Conventional Assets:
Baldwin Power Plant Extension (1,185 MW): The extension of this key asset through 2027 allows Vistra to maintain reliable power generation in the MISO market while transitioning to renewables. The move exemplifies strategic balance, ensuring reliability while supporting green energy goals.
Operational Flexibility: Vistra's ability to adapt its mix of assets enables it to capitalize on diverse market conditions.
Leadership and Regulatory Expertise:
Rob Walters Appointment: The recent addition of Rob Walters as an independent director strengthens Vistra’s regulatory and strategic leadership. This move enhances the company’s ability to navigate the evolving energy landscape, building investor confidence in its long-term strategy.
Investment Thesis:
Vistra is well-positioned to capitalize on both renewable energy growth and conventional energy reliability. The company's expansion into solar power and commitment to sustainable energy solutions, combined with the extension of key assets like Baldwin Power Plant, reinforces its competitive edge in a transforming energy market.
Bullish Case:
Target Price Range: $210.00–$220.00
Entry Range: $140.00–$142.00
Upside Potential: Strong growth potential due to diversified energy portfolio, renewable energy investments, and strategic leadership appointments.

Surpasses 170 as a sign of very bullish Been following the same chart patterns for YTD and the same pattern with consolidation and move up great catalyst, extraordinary fundamental value; TA has been scorching red hot. A closer look is a stairstep pattern on the daily.

Vistra Energy Stock Quote | Chart & Forecast SummaryKey Indicators On Trade Set Up In General
1. Push Set Up
2. Range Set up
3. Break & Retest Set Up
Notes On Session
# Vistra Energy Stock Quote
- Double Formation
* 130.00 USD | Survey Area Valid | Subdivision 1
* (Neckline) | Entry Bias Valid
- Triple Formation
* Pennant Structure | Uptrend & Continuation At 115.00 USD
* Retracement | 0.382)) | Retest | Hypothesis | Subdivision 2
* Daily Time Frame | Valid Area & Entry Settings | Subdivision 3
Active Sessions On Relevant Range & Elemented Probabilities;
London(Upwards) - NYC(Downwards)
Conclusion | Trade Plan Execution & Risk Management On Demand;
Overall Consensus | Buy

Consolidation area for reversal all indicators moving forwardThe oscillators are gearing up to bulls, and indicators are doing the same. The only thing that could change that course in direction is a few uncertainties in MACD, stochastic, and the bottom of the Bollinger and Keltner being around the low 130-135 area could test new highs for the longer term.

VST eyes on $142.02: Golden Genesis retest could launch next legVST pierced and is now retesting a Golden Genesis fib.
This would be a good entry point with a very tight SL.
Trump pump might be done, so proceed with caution.
$ 142.02 is the exact Golden Genesis fib.
$ 161.10 is the first target, a decent jump.
$ 130.23 is the first support for SL shield.
===============================================
.

Potential here to fall back to 140 before form new patternGood strength, relatively speaking; however, I can't seem to get it except for my head surrounding the way it is being shaped into a possible head-and-shoulders position that could mean a retrace rise and eventually FALL! Now, unexpectedly, this has broken through many barriers, but like any other stock, there is always going to be a time for bears and a time for bulls. I see that bears are favorable in the short term.

VST looking strong
- Good industry (Checkout NYSE:NRG NASDAQ:CEG NASDAQ:TLN )
- Strong market
- Good technical patterns

Hasn't broken the plains thinking about same pattern to supportThe same indicators see this going down; even though the catalyst is excellent, has good guidance, and has a better outlook, analysts have charged into seeing this higher and upgraded. In the short term, short.

Vistra: Oversold Pullback in Nuclear High Flier?Utility stock Vistra has been an unexpected beneficiary of the AI boom as datacenters gobble up electricity. It’s pulled back recently, and some traders may see an opportunity to follow its uptrend.
The first pattern on today’s chart is the breakout to new highs in late September and early October. Part of that surge resulted from Constellation Energy, a fellow nuclear generator, striking a historic power-supply agreement with Microsoft.
VST then held a 50 percent retracement of the move. That may confirm its direction is pointing higher.
Next, the support occurred near the weekly low of $114.84 from late September. It was tested on October 11 and again on Monday. A hammer candlestick followed, which was potentially confirmed by Tuesday’s bounce.
Finally, stochastics could be rebounding from an oversold condition.
TradeStation has, for decades, advanced the trading industry, providing access to stocks, options and futures. If you're born to trade, we could be for you. See our Overview for more.
Past performance, whether actual or indicated by historical tests of strategies, is no guarantee of future performance or success. There is a possibility that you may sustain a loss equal to or greater than your entire investment regardless of which asset class you trade (equities, options or futures); therefore, you should not invest or risk money that you cannot afford to lose. Online trading is not suitable for all investors. View the document titled Characteristics and Risks of Standardized Options at www.TradeStation.com . Before trading any asset class, customers must read the relevant risk disclosure statements on www.TradeStation.com . System access and trade placement and execution may be delayed or fail due to market volatility and volume, quote delays, system and software errors, Internet traffic, outages and other factors.
Securities and futures trading is offered to self-directed customers by TradeStation Securities, Inc., a broker-dealer registered with the Securities and Exchange Commission and a futures commission merchant licensed with the Commodity Futures Trading Commission). TradeStation Securities is a member of the Financial Industry Regulatory Authority, the National Futures Association, and a number of exchanges.
TradeStation Securities, Inc. and TradeStation Technologies, Inc. are each wholly owned subsidiaries of TradeStation Group, Inc., both operating, and providing products and services, under the TradeStation brand and trademark. When applying for, or purchasing, accounts, subscriptions, products and services, it is important that you know which company you will be dealing with. Visit www.TradeStation.com for further important information explaining what this means.

low risk entry hereAs long as the trend holds this is a low risk entry. You need to enter here, only bailing if the trend line fails to hold.

New Setup: VSTTCOM: I have a green setup signal(dot Indictor). It has a good risk-to-reward ratio(RR:). I'm looking to enter long near the close of the day if the stock can manage to CLOSE above the last candle highs(white line). If triggered, I will then place a stop-loss below(SL) and a price target above it(TP). Using the 10SMA as a trailing stop loss.
********
Note: The above setups will remain valid until the stock CLOSES BELOW my set stop-loss level.

Vistra's Nuclear Hype Is Getting Out Of HandHey all!
Welcome back - today we're talking about Vistra, the energy utility company that has been on a huge run in 2024.
Will shares continue their march, or is now a good time to cash in on gains? Let's dive in and find out.
Want more high-quality trade ideas? Follow us below. ⬇️⬇️
