VUG Monthly Symmetry 21 months from pandemic low to high. 50% correction (10 months). Then another 21 months to July 2024 high. Also, a low to high, high to high correlation.
Key stats
About VANGUARD GROWTH ETF
Home page
Inception date
Jan 26, 2004
Structure
Open-Ended Fund
Dividend treatment
Distributes
Distribution tax treatment
Qualified dividends
Income tax type
Capital Gains
Max ST capital gains rate
39.60%
Max LT capital gains rate
20.00%
Primary advisor
The Vanguard Group, Inc.
Distributor
Vanguard Marketing Corp.
The fund is passively managed to provide broad exposure to US large-cap growth firms. The index selects stocks based on six growth factors: expected long-term growth in earnings per share (EPS), expected short-term growth in EPS, 3-year historical growth in EPS, 3-year historical growth in sales per share, current investment-to-assets ratio, and return on assets. Securities are scored and ranked based on the composite of these growth factors, which is also the basis of their weighting. The resulting portfolio is a representative take on the large-cap growth space. The index is fully reviewed on a quarterly basis.
Classification
What's in the fund
Exposure type
Technology Services
Electronic Technology
Stock breakdown by region
Top 10 holdings

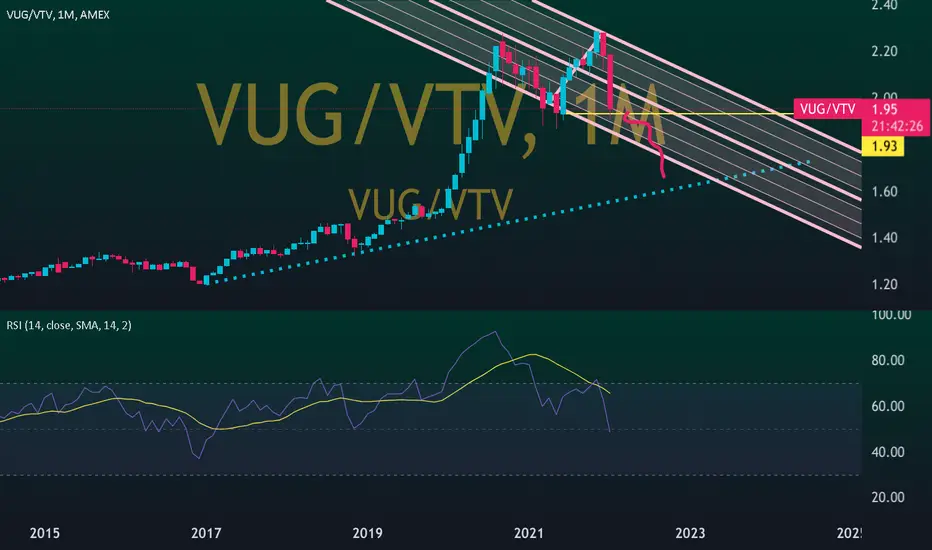
Growth stock's hiatus ?Growth stocks outperform value stocks most of the time on a weekly chart of $VUG / $VTV, Vanguard's growth and value elf's respectively.
Since the start of the 2022 bear market that relationship has reversed and, in August 2022, broke both horizontal support as well as a 14 year long diagonal sup

BTC and VUG (Vanguard growth ETF) comparison. VUG weekly chart with BTC overlayed. The VUG 200 MA has held up well as strong support for the market in the past. Could this be the bottom before the markets start recovering. Any thoughts or insights are appreciated.


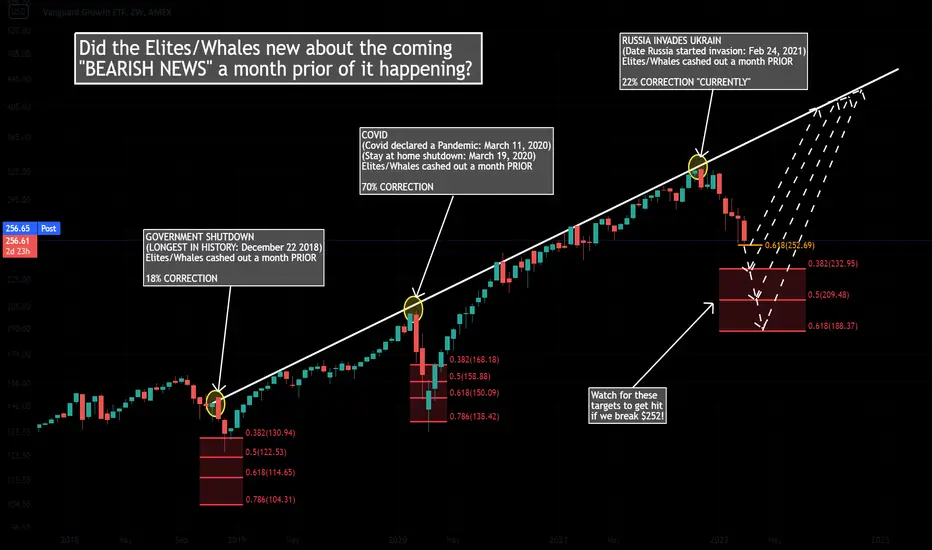
VUG - THEY knew about the corrections a month prior!THEY have the advantage of getting the "news" before the whole world hears about it.
Whales/elites will not miss any opportunities into making money. They simply buy the fear, hype up the market, take profit and crash it again after taking profit. Instead of beating then, lets ride with them! ;)
2018 Repeat - Growth stocks could still drop 15% before bounceFor growth stocks, I matched the pattern from 2018 to the current trading channels. If true, then there could be up to 15% downside in the coming weeks. The good news is that we could see a sizeable (30%) rebound afterwards.

Deep Fkn ValueWhilst i think we're going into a bear market
I think deep fkn value stonks
Will probs do quite well from here
Here we have growth/value which should return to trend
GRI 2022
a BTC indicator for falling price how low can we go VUG etf[This may be great indicator on the capitulation of price at end of carnage short term for BTC .Look at VUG etf price an if we see the dip close below 300 we can anticapate a 30K price in BTC. This will be a tremendious last chance to see this price in short term to buy it up ? I think this is it n

Growth vs Value - Potential Double Top with Inverse TrampolineThe growth/value ratio showed an inverse trampoline as
it retested a prior peak (possible double top). The daily
is shown as well to illustrate a further inverse trampoline
in concert with the weekly. My plan doesnt allow for
showing an intraday ratio chart, otherwise the hourly
would be shown as an


See all ideas
Summarizing what the indicators are suggesting.
Oscillators
Neutral
SellBuy
Strong sellStrong buy
Strong sellSellNeutralBuyStrong buy
Oscillators
Neutral
SellBuy
Strong sellStrong buy
Strong sellSellNeutralBuyStrong buy
Summary
Neutral
SellBuy
Strong sellStrong buy
Strong sellSellNeutralBuyStrong buy
Summary
Neutral
SellBuy
Strong sellStrong buy
Strong sellSellNeutralBuyStrong buy
Summary
Neutral
SellBuy
Strong sellStrong buy
Strong sellSellNeutralBuyStrong buy
Moving Averages
Neutral
SellBuy
Strong sellStrong buy
Strong sellSellNeutralBuyStrong buy
Moving Averages
Neutral
SellBuy
Strong sellStrong buy
Strong sellSellNeutralBuyStrong buy
Displays a symbol's price movements over previous years to identify recurring trends.
Related funds
Frequently Asked Questions
An exchange-traded fund (ETF) is a collection of assets (stocks, bonds, commodities, etc.) that track an underlying index and can be bought on an exchange like individual stocks.
VUG trades at 8,005.00 MXN today, its price has risen 2.96% in the past 24 hours. Track more dynamics on VUG price chart.
VUG net asset value is 8,009.79 today — it's risen 16.93% over the past month. NAV represents the total value of the fund's assets less liabilities and serves as a gauge of the fund's performance.
VUG assets under management is 3.19 T MXN. AUM is an important metric as it reflects the fund's size and can serve as a gauge of how successful the fund is in attracting investors, which, in its turn, can influence decision-making.
VUG price has risen by 13.15% over the last month, and its yearly performance shows a 36.26% increase. See more dynamics on VUG price chart.
NAV returns, another gauge of an ETF dynamics, have risen by 16.93% over the last month, showed a −8.43% decrease in three-month performance and has increased by 36.09% in a year.
NAV returns, another gauge of an ETF dynamics, have risen by 16.93% over the last month, showed a −8.43% decrease in three-month performance and has increased by 36.09% in a year.
Since ETFs work like an individual stock, they can be bought and sold on exchanges (e.g. NASDAQ, NYSE, EURONEXT). As it happens with stocks, you need to select a brokerage to access trading. Explore our list of available brokers to find the one to help execute your strategies. Don't forget to do your research before getting to trading. Explore ETFs metrics in our ETF screener to find a reliable opportunity.
VUG invests in stocks. See more details in our Analysis section.
VUG expense ratio is 0.04%. It's an important metric for helping traders understand the fund's operating costs relative to assets and how expensive it would be to hold the fund.
No, VUG isn't leveraged, meaning it doesn't use borrowings or financial derivatives to magnify the performance of the underlying assets or index it follows.
In some ways, ETFs are safe investments, but in a broader sense, they're not safer than any other asset, so it's crucial to analyze a fund before investing. But if your research gives a vague answer, you can always refer to technical analysis.
Today, VUG technical analysis shows the buy rating and its 1-week rating is buy. Since market conditions are prone to changes, it's worth looking a bit further into the future — according to the 1-month rating VUG shows the strong buy signal. See more of VUG technicals for a more comprehensive analysis.
Today, VUG technical analysis shows the buy rating and its 1-week rating is buy. Since market conditions are prone to changes, it's worth looking a bit further into the future — according to the 1-month rating VUG shows the strong buy signal. See more of VUG technicals for a more comprehensive analysis.
Yes, VUG pays dividends to its holders with the dividend yield of 0.47%.
VUG trades at a premium (1.25%).
Premium/discount to NAV expresses the difference between the ETF’s price and its NAV value. A positive percentage indicates a premium, meaning the ETF trades at a higher price than the calculated NAV. Conversely, a negative percentage indicates a discount, suggesting the ETF trades at a lower price than NAV.
Premium/discount to NAV expresses the difference between the ETF’s price and its NAV value. A positive percentage indicates a premium, meaning the ETF trades at a higher price than the calculated NAV. Conversely, a negative percentage indicates a discount, suggesting the ETF trades at a lower price than NAV.
VUG shares are issued by The Vanguard Group, Inc.
VUG follows the CRSP US Large Growth. ETFs usually track some benchmark seeking to replicate its performance and guide asset selection and objectives.
The fund started trading on Jan 26, 2004.
The fund's management style is passive, meaning it's aiming to replicate the performance of the underlying index by holding assets in the same proportions as the index. The goal is to match the index's returns.