VZ trade ideas

How To Utilize Difference In Price Indicator The difference in price indicator helps show volatility. In this case I am going long on Verizon but am unsure of how much to expect the price to move each day. When I add the Difference In Price indicator to my chart, I can scroll my cross hairs over and see that it changes in price about $1 a day. So for tomorrow I can expect it to go up or down $1 based on what has historically happened.
The Difference In Price Indicator can be used on any candle segment, but my favorite is the day because I like knowing how much to expect a stock to change in price on a daily basis.
To add the Difference In Price Indicator to your chart, you can click on the F(x) button and then click on public library. Type in Difference In Price. Add the one created by Myantman101 ( free )
Test it out on different segments and see for yourself how it can help determine what type of price change to expect when shorting or going long.
Comment any questions below

Breaking Resistance On The 1 HRVerizon is about to break through resistance on the 1 hour chart and has potential to reach an all time high. I will be following this stock closely as I have 50 calls for it to be worth $61 a share by 12/11. I need it to hit $62 a share this week to 5x my money. Looking to make big profit but as soon as I see a reason to drop out I will. Stay tuned for more!

Breaking $61 This WeekI see Verizon breaking $61 a share this week which is why I purchased 50 calls for it to hit $61 a share by 12/11.
I plan on selling out this week to take the largest profit.
I'll let the chart do the talking

Iron TariHi guys,
just as described in my strategy we have 4weeks 10% strikes.
The maths are simple, just have a look at the strategy, and all the iron conodrs I shared in "ideas".
I DON'T BUY THE LONG LEGS THIS TIME, I MAKE A SHORT STRANGLE, BECASE THE ODDS ARE SO GOOD.
Enjoy your wallet!
Tari.
VZW looks pretty good hereVZW might present good risk/reward as the worst of it might be over for the short term, if you zoom out there is clearly a long up term trend, and I like this recent breakout with (I assume) the vaccine news. Here is an example trade.

Verizon can jump todayHL HH + trendline + Fib 61.8 on min/max candles + 200 d1 SMA + MTF oversold (h1-h4-d1) + earnings today may boosts or kills the setup

VZ to $61 - $61.40Its possible $VZ could go long, falling wedge has appeared and price has started to breakout. Its possible that it could be a FAKE OUT, also price is near $VZ's high. Potential target is $61 - $61.40

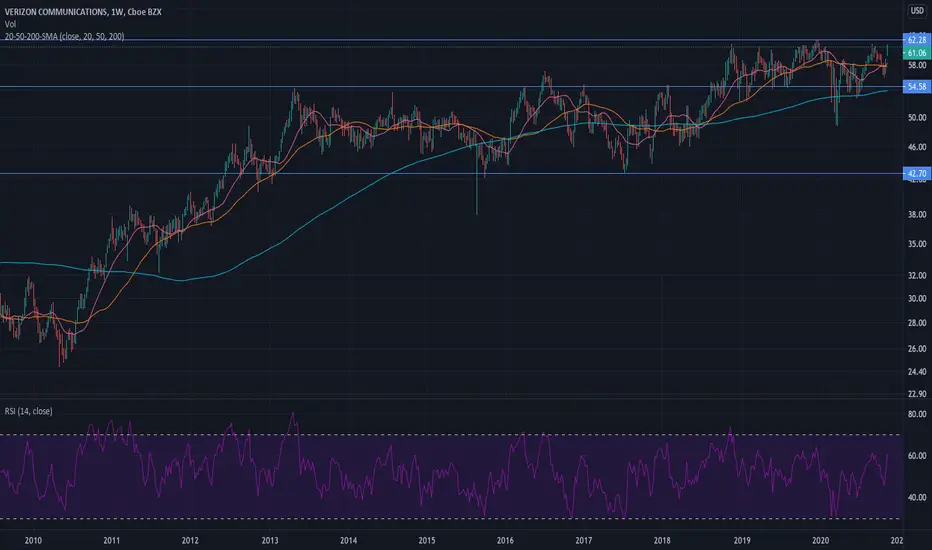
i thought MSFT was badthis gives consolidation a whole new meaning. 20 dollar move to the upside in the past 8-10 years! wow ! i feel sorry for any longs here. even though the charts a uptrend i am bearish. yikes long right here. thank you for your time! leave a like if you found this helpful ! <3

ABC BullishLots like VZ for the yield.
For some reason VZ seems to struggle a lot of the time.
NV is high Short interest is low
Seems to be recovering from it's fall from the bearish rising wedge
Just an observation

VZ - Elliottwave analysis - Sell on bounceVZ - It is in WXY double zigzag correction and underperforming the SPX. The drop was completed A of Y wave and correcting up in B wave, which would expected to finish near 57.50 level. Sell for C wave down as the final cycle of Y wave in that zone.
Give thumbs up if you really like the trade idea.

$VZ Posted less than expected Earning$VZ posted less than expected earning with the PEAD projecting a neutral outlook for the stock price, Currently the price is trading just above the upper boundary of the PEAD cone.


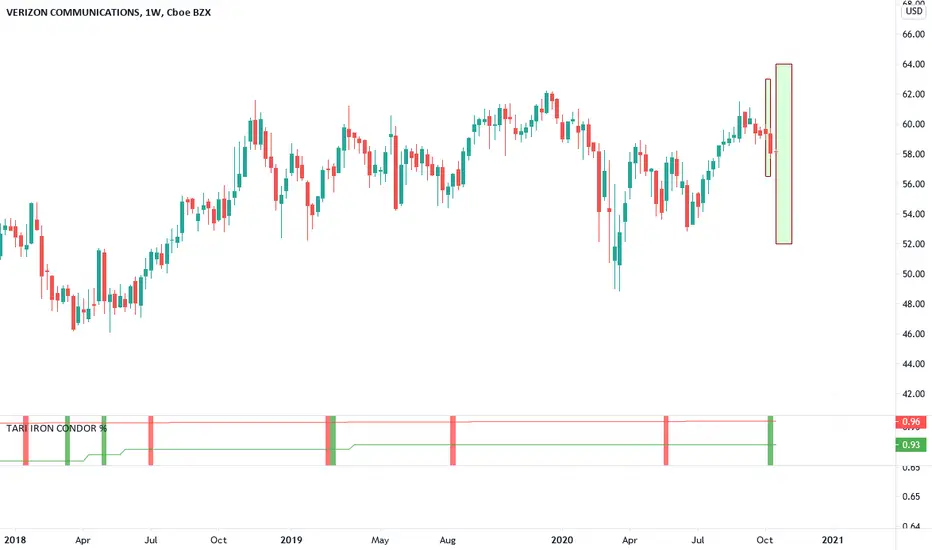
Tari CondorHi guys,
for this iron condor we have 2 weeks and 5% strike.
Reward risk ratio is quite decent, but I prefer to place a pending order to get some more premium.
Enjoy your wallet!
Tari.

Verizon - 5G
NOTES
Verizon has surprisingly tanked after the new 5G announcement that came-out, overall, it wasn't too surprising. We're without a doubt in short term bearish sentiment for the stock. However this sentiment appears to be coming after a very decent impulse wave rally (not the traditional pattern, appears to be a Moving Ending Diagonal Impulse with converging lines) Short term, we may see a rally around 1.5% strong from Friday's close of 58.05. This is likely to be sold off down to the 0.312 fib retrace of the longer-term impulse wave we're tracking. After this, it's a whole new set of impulse waves on VZ
Likely Scenario: Timeline 3-4 Weeks
1 - VZ rises from 58.05 to the upper $58-$59 range and is rejected.
2 - VZ continues this rejection from that upper range down to the upper to mid $56 range
3 - VZ breaks out of the short term bearish descending channel we see now and begins to hit new ATH's.
Alternate Scenario: Timeline 1-2 Weeks
1 - VZ rises from 58.05 to the upper $58-$59 range and breaks through.
2 - VZ continues this breakthrough through the short term downward bearish channel we see now, and starts it's new impulse wave to new ATH's earlier then expected.
Key Takeaways
Both scenarios end in bullish long-term action estimated timeline for the breakout is within the next month overall. Currently eyeing 6 month long $60 call contracts, not that expensive.

VZ long, at Support Long term Uptrend,
Reversal candle at support
Entry 58.5
Stop 57.4
Target 61.5; reward:risk=3:1
Earning 10/21/2020,
I am not a PRO trader. I need few months to practice trading strategies.
If you like this idea, please use SIM/Demo account to try it, until my trading plans get high winning rate.


Buy a few VZ at 2h buy signalSlightly buy a few VZ to see if there is a jump after earning.
It should has strong support and good earn ratio.

$VZ fractal ~target for next month~
a possible debit spread position:
C 10/16 62.5 BUY
C 10/16 65 SELL


VZ - Better View of Weekly Bullflag Looking like momentum is building in this one... 61.01 trigger to move to orange target and could blow right through. Good luck if you play!
