WFC trade ideas


Ascending triangle in WFObserving this ascending triangle, I would wait to see if the stock price brake up, to buy a long position. If the price comes again to the triangle area, the pattern would have failed.


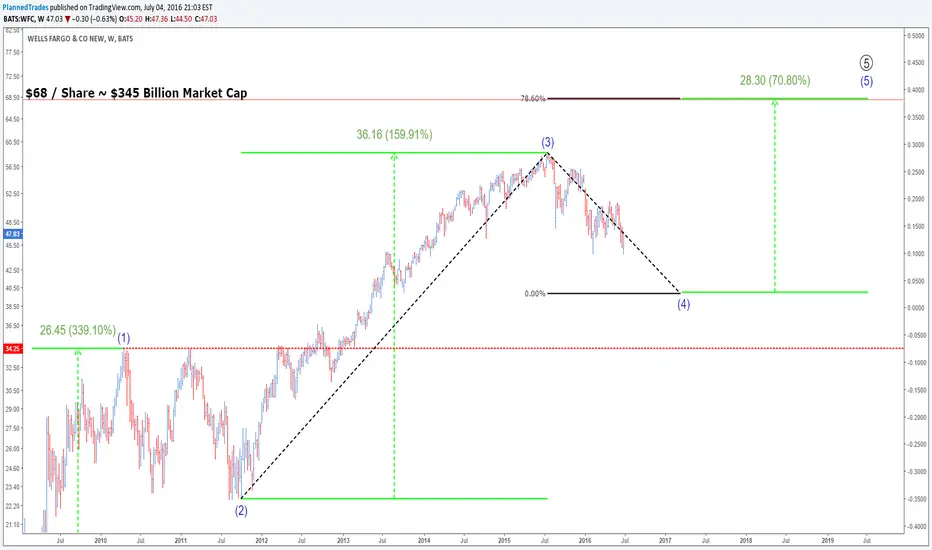
Revised Target: $68 / share...otherwise wave 3 would be the shortest. Still bullish, but I guess the raising of interest rates in the future will peak WFC around $70. Buy pullback if it hits $40.
Bullish Impact on FinancialsPerhaps this is the best bank stock chart in the S&P 500. I don't think GS or JPM are as clean, but I'll post some counts for them as well.


WFC and other Financials Looking Grim WFC has been unable to gain 50.5-51 resistance for months now, and the chart may indicate that it is time to retest lower. the last weekly level retest was 44.59, which bounced strongly and reversed. if 46.6 is lost, we should look towards 43.2 for next support test.
Lower still is 41.65 and 38.03 as well as others, but these levels may not apply for some time

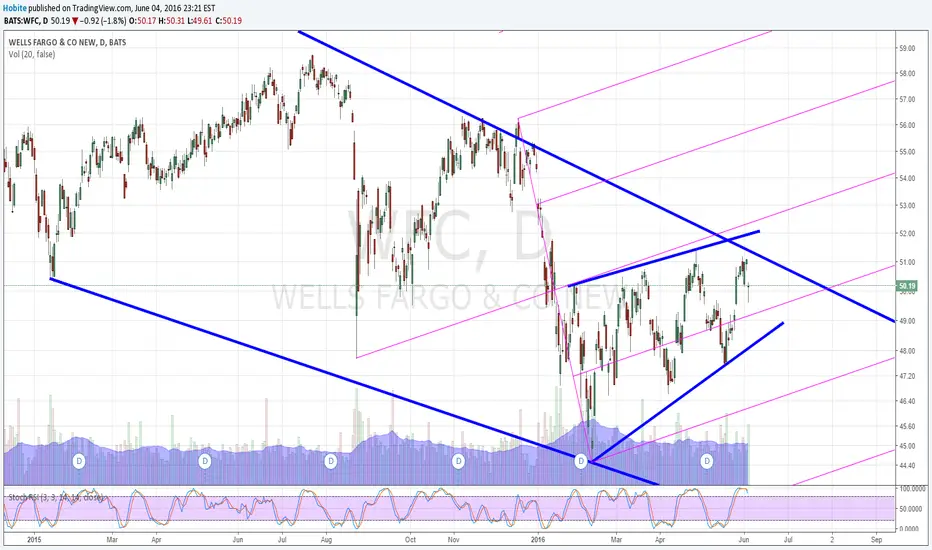


Wells Fargo: Chart showing possible continuation of Bull trendThis is a long term set up, that will most likely take sometime to confirm. Price has made a double bottom at the 200 weekly period moving average. In addition we are forming a falling wedge. The size of the wedge suggests that if it does break it could be a significant move to the up-side.
The candle of the week 02-08 tested the highs made in 2008 as support, an additional strong bullish sign.
We can also see that buying volume has picked up in the past week. Will be monitoring this stock for a breakout.

Correction doneWe got all now - lower highs and lower lows as well. And the correction confirmed the trend change down.

West Fargo sports a nice bullish Elliott lookWFC seems to tell us that the big scare was actually just a correction within a bull market. The right look suggests WFC is on its way to new high. We even have the rule of alternation with wave 2 being an expanded flat while wave 4 is a simple ZigZag. The only thing I don't like is within the zigzag both wave are sharp. Usually one is a surprise to everybody while the other is grinding your patience. That might suggest wave 4 is not over and we will grind sideways for a while before WFC resumes its ascent to end the huge active wave that started from the 2009 low. That might even indicate the beginning of another financial crisis.
Moving below 46 will indicate either wave c is not over or I am wrong dead wrong.

Has shown some strength compared to the restPrice didn't violate Aug low while most of the banks trades below that level. One important support has been broken and now is overhead resistance. Time to observe for long entry but so far in the worst comp. Real-time alerts go www.2waytrading.com


Daily reversals caught on the Elite Zone These are three examples of the trade ideas the Elite Zone members received over the last few weeks.
Yea.. it took a lot of patience! This is part of swing trading and part of being a successful trader.
Want to see more of our trades? Check it out here:
marketzone.tumblr.com
If you like harmonics? Follow the blog and on TradingView

Bullish Near-Term Setup In Wells Fargo SharesToday, 10,000+ WFC Mar 20 $56 calls traded with the vast majority being bought for $0.35-$0.45 each, against no previous open interest. For every put that traded in the session, 2.5 calls traded (18,568 total).
Talk of a Fed Funds rate hike later this year is bullish for financial companies like Wells Fargo and the stock remains relatively inexpensive. WFC trades at a P/E ratio of 13.25x (2015 estimates), P/S ratio of 3.42x, and a P/B ratio of 1.70x. The top line is projected to increase 3.9% this year and accelerate 6.1% in 2016 ($93B).
Looking at the daily chart above we can see another 1% or so rise in shares would confirm a technical breakout (confirming the fundamental analysis and options activity). A low risk way to play it would be via Mar 20 $55 or $56 calls or via longer dated bull call spreads (July $55/$60 call spread) for a favorable reward/risk ratio to the higher $50's/low $60's.


Wells Fargo & Co - WFC - Daily -Sometimes a picture tells it allSometimes all you need to do is to see a picture to know what to do....
Agree??
