XLK reached pitchfork support line, will go upXLK reached pitchfork support line and is expected to start going up (the market as well for that matter, as other symbols such as TQQQ show this).
XLK trade ideas


XLK - should be srarting the upward correction soonXLK could have completed the impulse to the downside, with some possibility left for one more poke . At least that is what the divergence in momentum is suggesting. Two gaps, conveniently located at fibonacci levels shouls serve as resistance.

XLK Technology Sector: Signals of DivergenceAs the growth sector #XLK and #NDX makes lower lows there are spots of divergence displaying, which could pose as some upward impulses this week. In that case it could help to normalize a temporary ‘higher low’ in terms of the holistic outlook.
My TradingView charts (found at #bsdvs23) have mostly been bearish across the board with a few ‘potential’ bullish intraday traders here-and-there based on the broader technical structure. But that is neither here nor there since the major outlook of the trends is what is most important.
All that being said, signs of divergence are now signaling that this area of ‘the higher low’ (big picture) could be setting up for the next leg upward impulse movement in an effort of retesting the lower highs. Granted this will take ‘time and price’ to get to that level and coincidentally coincides with the major earnings session upon us.
And I should point out the bearish side of things as well to ensure the audience has the perspective of both sides here. The downside risk is the markets heading for those March lows. Something I have been very focused on the entire month of April in my YouTube videos, Facebook posts, and postings within TradingView.
All-in-all, divergence is poking its head and that should provide caution to the wind for the bears.
We will keep watch and monitor the Futures Markets as well as the sector spiders and other stocks for turning points going into the economic events this week as I will notate those below.
Mon, Apr 18
- 10:00am NAHB Housing Market Index
- Day 1 IMF Meetings
- 4:00pm FOMC Member Bullard Speaks
Tue, Apr 19
- 8:30am Building Permits
- Housing Starts
- Day 2 IMF Meetings
Wed, Apr 20
- 10:00am Existing Home Sales
- Day 3 IMF Meetings
- 10:30am Crude Oil Inventories
- 2:00pm Beige Book
Thu, Apr 21
- 8:30am Philly Fed Manufacturing Index
- Unemployment Claims
- 10:00am CB Leading Index
- Day 4 IMF Meetings
- 10:30am Natural Gas Storage
- 1:00pm Fed Chair Powell Speaks
Fri, Apr 22
- 9:45am Flash Manufacturing PMI
- Flash Services PMI
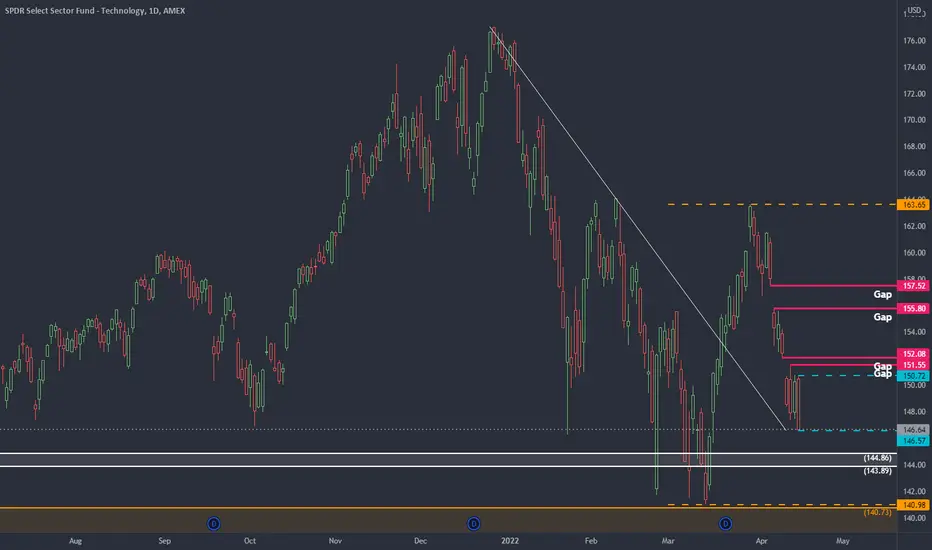
XLK - clear five waves downIn my book, and for what it's worth, this is a clear five wave impulse to the downside. No overlap, textbook alternation between waves 2 and 4, following a well defined trendline. Resistance should be at 156-158 area. It is certainly worth paying attention to further developments in XLK, as there will be no advance in major indicies without the tech sector.

Head and Shoulders Short entry with a break of the neckline and a confirmed downtrend.
Possible stop above the neckline for short entry.
No recommendation.
1st shoulder is 160.13. 2nd shoulder is 164.10. Head is 177.04.
Targets in larger orange type are targets 1. If price goes below this, the targets in smaller type are targets 2.

Growth vs Value. Technology vs Energy.While these two charts aren't the same, they are very similar. The top chart is a ratio chart of ARKK vs Berk.B. The bottom chart is a ratio chart of Tech vs Energy. If the top chart is any indication of the overall trend, then there's plenty of upside in energy still. The downside of ARKK vs BERK.B overshot the minimum downside target. This is a logical area for a bounce. The Tech vs Energy ratio looks to have a ways to go still. These rounded tops are very dependable reversal patterns. Keep your eye open for broken support lines when watching these rounded tops play out.

technology etf cup/handle breakout into a bull flag set up1hr time frame shows a cup and handle pattern breakout, even the smaller cup/handle breakout is on the 15min, this is also setting up the bull flag breakout.. It also coincides w/ the larger cup and handle breakout pattern set up on Apples Daily chart

XLK Technology ETF - Trend Lines compared to Dot Com CrashA look at how the counter rallies in the dot com crash compare to the market since 2003. The dark red lines all have the same slope on the log scale. I just moved them to align to the peaks.
You can also see that last week caused the price to break down out of the trading channel started in 2019 and then a retest Friday. This morning we are hovering under it.
It is not looking too good for tech since it has both to recapture the channel and break back above the trend line anchored to Jan 2001 peak. Crossing fingers.
1W
1D
Rejected off both the 20 and 200 day moving averages.

XLK: failed H & S? Bottom is in? To be confirmed next weekXLK on 25 Feb shows signs of bottom. However it may still be rejected by the blue trend line & make a double bottom. Breakout of that blue line will VOID the H & S pattern & uptrend channel will continue to be respected.
Target price will be 188, a 30% upside from my predicted double bottom.
But if some good news will come next will, XLK will just cut through the blue line & never look back…
considering there is a slight bullish divergence on RSI.
Not trading advice but hope this helps

Head and ShouldersSPrice has not broken the neckline. This pattern is not valid until the neckline is broken with a confirmed downtrend.
After the break of the neckline, and one was planning to short this, possible stop above the neckline. Neckline is 146.24.
No recommendation.
NOT VALID until neckline is broken with a downtrend

1-2-3 Chart Pattern Break below support line would confirm pattern and target would be 50 percent from bottom to high.

Tech rebound dueAfter a descent 15 per cent correction many stocks have come to fair valuations. Fibo 2.0 is the key

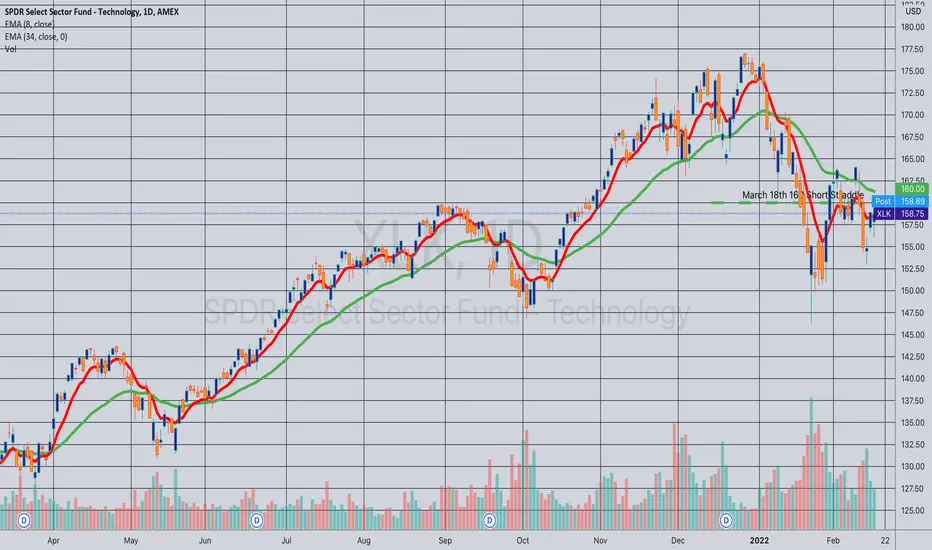
Closed: XLK March 18th 160 Short Straddle... for 9.80/contract debit.
Comments: Collected a total of 11.03/contract with various defensive rolls and roll out for duration. (See Post Below). Closed it out today for 9.80, a 1.23 ($123) profit/per contract.
XLK Headed for a double Bottom on 10/4/21 low10/4/21 low in play, below resistance and in Gartley pattern downtrend.

Reversion Strat» Stop Loss can be set in settings. 0.90, means that it will apply a 10% stop loss setting.
» You can set how many shares it buys at a time
» MaPeriod, that is set to 5, looks to buy shares if instruments price dips below this moving average.
» I have set the broker fee to $1, that's what I pay with Interactive Brokers, but you can edit that in the code as you wish
// COMMENTS
//——————————————————————————————————————————————————————————————————————————————
// » MEAN REVERSION SYSTEM, NOT A TREND TRADING SYSTEM
// » DESIGNED TO WORK ON ETF WITH GOOD LINEARITY
// » PRICE MUST BE ABOVE 200 MA
// » CLOSE MUST BE BELOW THE FastMa TO BUY AT LOW PRICES
// » USE ONLY ON DAILY OR HIGHER TIME FRAMES
// » IMPORTS DATA FROM LOWN TICKET TO CHECK THAT NOT TOO MANY STOCKS ARE MAKING NEW HIGHS
Can be used on tickers like
SPY, SPX, SSO, SPXL, TQQQ, QQQ, and sector ETFs like these below.
AMEX:XLE,AMEX:XLF,AMEX:XLK,AMEX:XLB,AMEX:XLU,AMEX:XLI,AMEX:XLV,AMEX:XLY,AMEX:XRT,AMEX:XLP,AMEX:XLRE,AMEX:XLC,AMEX:XSD,AMEX:XTL,AMEX:GXC
Can also be used on stocks, I would recommend adjusting the stop loss and MaPeriod to dip buy

Rolling: XLK February 18th Short Strangles to March 18th 160... short straddle.
Comments: Locking in some realized gains by rolling the 151/160 and the 157C/158P inverted out to the March 18th 160 short straddle. I had to do this in separate rolls, receiving 7.19 in credits for the roll of the 151/160 and 3.67 for the roll of the slightly inverted 157C/158P. I've collected a grand total of 22.07 in credits (11.035/contract) relative to a current setup value of 11.75 per contract, so am still slightly underwater in the position. As usual, will continue to do defensive adjustments as necessary to keep from getting too directional.

Technology possible bear marketThe monetary policy and economy cycle show us a high probability of a lower down movement. After a solid rebound though

Tech Sector Setting Up for Big Monthly Bearish PullbackWe have a Bearish Engulfing on the Monthly along side with extreme amounts of RSI Bearish Divergence and soon the MACD will be crossing bearishly for the first time since 2018. In the past the monthly bearish crossing has lead to at least a 30% correction back down to the 55 Month SMA.
One last thing to note is that if this Monthly Candle continues down a little further and closes below the open of October 2021, this pattern will be upgraded from just a simple Bearish Engulfing to being a Bullish Three Line Strike visible on the Monthly Timeframe which is a very bearish pattern as One Month would have Erased the gains of the Prior 3 Months and at that point you almost have a Guarantee that the Tech Sector will see a much more Sustained Correction the Downside.

Opened: XLK February 18th 158/185 Short Strangle... for a 2.33 credit.
Comments: Selling premium in XLK, which is closely correlated to both the broad market and QQQ, so it's kind of QQQ "lite" (a QQQ 16-delta short strangle would tie up about twice as much buying power). 2.33 credit on buying power effect of 23.28 (on margin). 10.0% ROC at max; 5.0% ROC at 50% max.

Opening: XLK February 18th 151/180 Short Strangle... for a 2.58 credit.
Comments; Adding to my QQQ "lite" position here. Will look to take profit at 50% max, manage sides on approaching worthless/side test.
I can also conceivably mix and match sides to take profit and reduce risk, since I've not got four legs on (151P/158P/180C/185C) or take profit on the entire four leg setup at 50% max.

Tech Going Lower?AMEX:XLK
Looking at the XLK chart, more downside appears likely.
The market regime is changing, and a rotation out of growth into value/defensive is in full swing.
XLK is showing Bearish divergence on the MACD & RSI , plus confirmation of the 9EMA is crossing under the 20EMA.
Typically, breakdowns out of this kind of chart pattern usually fall about 10-12%
While I don't believe that will happen immediately, I could see it finding support around the $148 / 0.618 fib level in the next couple of weeks.
I am going to keep an eye on the chart pattern and wait to see a breakdown below it.

Technology retest on a downtrendLooks like broken 50ma is broken and we are having a retest on a way down
