ASX to see a temporary move higher?ASX200 - 24h expiry
Buying pressure from resulted in prices rejecting the dip.
The current move higher is expected to continue.
Short term bias has turned negative.
We therefore, prefer to fade into the rally with a tight stop in anticipation of a move back lower.
Further downside is expected although we prefer to sell into rallies close to the 7190 level.
We look to Sell at 7190 (stop at 7230)
Our profit targets will be 7070 and 7010
Resistance: 7215 / 7305 / 7435
Support: 7010 / 6825 / 6660
Risk Disclaimer
The trade ideas beyond this page are for informational purposes only and do not constitute investment advice or a solicitation to trade. This information is provided by Signal Centre, a third-party unaffiliated with OANDA, and is intended for general circulation only. OANDA does not guarantee the accuracy of this information and assumes no responsibilities for the information provided by the third party. The information does not take into account the specific investment objectives, financial situation, or particular needs of any particular person. You should take into account your specific investment objectives, financial situation, and particular needs before making a commitment to trade, including seeking advice from an independent financial adviser regarding the suitability of the investment, under a separate engagement, as you deem fit.
You accept that you assume all risks in independently viewing the contents and selecting a chosen strategy.
Where the research is distributed in Singapore to a person who is not an Accredited Investor, Expert Investor or an Institutional Investor, Oanda Asia Pacific Pte Ltd (“OAP“) accepts legal responsibility for the contents of the report to such persons only to the extent required by law. Singapore customers should contact OAP at 6579 8289 for matters arising from, or in connection with, the information/research distributed.
AUS200 trade ideas

XJO - Weekly Analysis ASX:XJO
Week Ending - 23 rd June The tail end of last week saw a steep decline in the Australian market.
We might see some short term rebounds before further falls next week and through July.

ASX200 breakout failedASX200 breakout failed and there could be a turn around to the downside for the days to come.

The swing low could be in for the ASX 200 (XJO)The ASX 200 suffered its worst day in 10-week on the final day of May, thanks to weak China PMIs and month-end flows. The first day of June posted a very minor (almost sheepish) gain, but with a positive lead from Wall Street and SPI futures higher by ~0.66% overnight, the ASX is expected to extend its rise from the lows.
The fact that the lows formed around a 61.8% Fibonacci ratio 7070 support level alongside a bullish RSI divergence could bode well for bulls over the near-term. From here the bias is bullish above last week's low and for a move to the 7200 area, within the channel. But as the channel appears to be corrective in nature then we also see the potential for it to head for (and break above) the 7300 highs.
But as we're a period of the year notorious for fickle price action and lower trading volumes, traders might be wise to remain nimble and seek smaller moves unless a large macro theme arrives worthy of expecting broad-range expansion for global markets.

$ASX:XJO Break Out - Ascending Triangle Next Week?? Could we be looking at a potential break out to the upside next week given the triangle pattern forming??

ASX to find sellers at trend line?ASX200 - 24h expiry
Although the bulls are in control, the stalling positive momentum indicates a turnaround is possible.
We are trading at overbought extremes.
This is negative for short term sentiment and we look to set shorts at good risk/reward levels for a further correction lower.
The hourly chart technicals suggests further upside before the downtrend returns.
We look to sell rallies.
We look to Sell at 7220 (stop at 7270)
Our profit targets will be 7095 and 7065
Resistance: 7305 / 7435 / 7600
Support: 7120 / 7010 / 6825
Risk Disclaimer
The trade ideas beyond this page are for informational purposes only and do not constitute investment advice or a solicitation to trade. This information is provided by Signal Centre, a third-party unaffiliated with OANDA, and is intended for general circulation only. OANDA does not guarantee the accuracy of this information and assumes no responsibilities for the information provided by the third party. The information does not take into account the specific investment objectives, financial situation, or particular needs of any particular person. You should take into account your specific investment objectives, financial situation, and particular needs before making a commitment to trade, including seeking advice from an independent financial adviser regarding the suitability of the investment, under a separate engagement, as you deem fit.
You accept that you assume all risks in independently viewing the contents and selecting a chosen strategy.
Where the research is distributed in Singapore to a person who is not an Accredited Investor, Expert Investor or an Institutional Investor, Oanda Asia Pacific Pte Ltd (“OAP“) accepts legal responsibility for the contents of the report to such persons only to the extent required by law. Singapore customers should contact OAP at 6579 8289 for matters arising from, or in connection with, the information/research distributed.

ASX in a trend of lower highs.ASX200 - 24h expiry - We look to Sell at 7210 (stop at 7260)
Posted a Double Bottom formation.
Neckline comes in at 7133.
We are trading at overbought extremes.
This is negative for short term sentiment and we look to set shorts at good risk/reward levels for a further correction lower.
The 200 day moving average should provide resistance at 7210.
Our profit targets will be 7085 and 7010
Resistance: 7215 / 7435 / 7600
Support: 7010 / 6825 / 6660
Risk Disclaimer
The trade ideas beyond this page are for informational purposes only and do not constitute investment advice or a solicitation to trade. This information is provided by Signal Centre, a third-party unaffiliated with OANDA, and is intended for general circulation only. OANDA does not guarantee the accuracy of this information and assumes no responsibilities for the information provided by the third party. The information does not take into account the specific investment objectives, financial situation, or particular needs of any particular person. You should take into account your specific investment objectives, financial situation, and particular needs before making a commitment to trade, including seeking advice from an independent financial adviser regarding the suitability of the investment, under a separate engagement, as you deem fit.
You accept that you assume all risks in independently viewing the contents and selecting a chosen strategy.
Where the research is distributed in Singapore to a person who is not an Accredited Investor, Expert Investor or an Institutional Investor, Oanda Asia Pacific Pte Ltd (“OAP“) accepts legal responsibility for the contents of the report to such persons only to the extent required by law. Singapore customers should contact OAP at 6579 8289 for matters arising from, or in connection with, the information/research distributed.


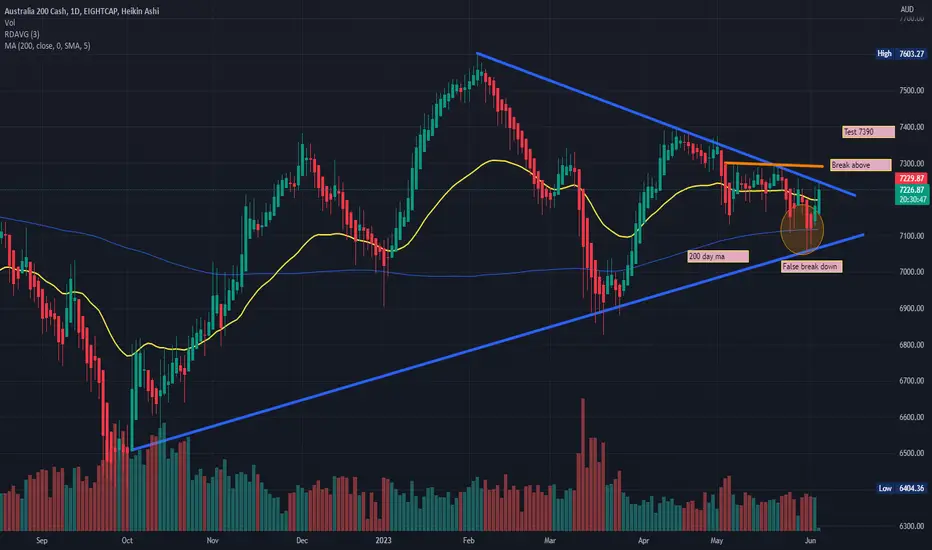
#ASX200 ASX200 Triangle Formation #StocksA false break down preceded by a positive start on 5th June confirmation of range continuation.
A test and break above 7280 would indicate a test of 7390
It could be now or never for ASX 200 bullsI suspect it could be a case of now or never for ASX bulls.
Whilst it suffered its worst day in 9-weeks on Thursday, this could be part of an ABC correction and the 200-day MA is nearby as a probably support level, even if it breaks lower today. Futures markets shows heavy volume occurred around yesterday's lows (bears piled in around the lows) yet sentiment could rise if a debt ceiling deal is reached as reported, forcing a short-covering rally.
Yesterday’s low sits around a 50% retracement and 61.8% projection level, and there is a volume cluster around 7122 during the strong rally which could provide support. Furthermore, RSI (2) is oversold.
The bias is bullish above 7090 (below the 200-day MA) and for its next leg higher to begin.

ASX to stall at previous swing high?ASX200 - 24h expiry
Buying pressure from 7053 resulted in prices rejecting the dip.
The current move higher is expected to continue.
The bias is still for lower levels and we look for any gains to be limited.
We therefore, prefer to fade into the rally with a tight stop in anticipation of a move back lower.
Further downside is expected although we prefer to sell into rallies close to the 7230 level.
We look to Sell at 7225 (stop at 7265)
Our profit targets will be 7125 and 7105
Resistance: 7215 / 7305 / 7435
Support: 7010 / 6825 / 6660
Risk Disclaimer
The trade ideas beyond this page are for informational purposes only and do not constitute investment advice or a solicitation to trade. This information is provided by Signal Centre, a third-party unaffiliated with OANDA, and is intended for general circulation only. OANDA does not guarantee the accuracy of this information and assumes no responsibilities for the information provided by the third party. The information does not take into account the specific investment objectives, financial situation, or particular needs of any particular person. You should take into account your specific investment objectives, financial situation, and particular needs before making a commitment to trade, including seeking advice from an independent financial adviser regarding the suitability of the investment, under a separate engagement, as you deem fit.
You accept that you assume all risks in independently viewing the contents and selecting a chosen strategy.
Where the research is distributed in Singapore to a person who is not an Accredited Investor, Expert Investor or an Institutional Investor, Oanda Asia Pacific Pte Ltd (“OAP“) accepts legal responsibility for the contents of the report to such persons only to the extent required by law. Singapore customers should contact OAP at 6579 8289 for matters arising from, or in connection with, the information/research distributed.

On the way to 6400?Bearish break out of ascending wedge with retest complete. Target for this is around 6600; however if this happens we will also likely complete the head and shoulders pattern.
A break of this neckline takes us down to 6400 where we find strong support.

LONG - AUS200 (H1) (24 May 2023)Weekly Trend Up
Daily Trend UP
- Expect price to pierce deeper and lower into H4 zone before rallying.
- Alert set in H1 to place pending order once it is closer to target trigger price

AU200 to see a temporary move higher?ASX200 - 24h expiry
Previous support level of 7129 broken.
Short term bias has turned negative.
Preferred trade is to sell into rallies.
The hourly chart technicals suggests further upside before the downtrend returns.
Further downside is expected although we prefer to sell into rallies close to the 7190 level.
We look to Sell at 7190 (stop at 7230)
Our profit targets will be 7090 and 7010
Resistance: 7215 / 7305 / 7435
Support: 7010 / 6825 / 6660
Risk Disclaimer
The trade ideas beyond this page are for informational purposes only and do not constitute investment advice or a solicitation to trade. This information is provided by Signal Centre, a third-party unaffiliated with OANDA, and is intended for general circulation only. OANDA does not guarantee the accuracy of this information and assumes no responsibilities for the information provided by the third party. The information does not take into account the specific investment objectives, financial situation, or particular needs of any particular person. You should take into account your specific investment objectives, financial situation, and particular needs before making a commitment to trade, including seeking advice from an independent financial adviser regarding the suitability of the investment, under a separate engagement, as you deem fit.
You accept that you assume all risks in independently viewing the contents and selecting a chosen strategy.
Where the research is distributed in Singapore to a person who is not an Accredited Investor, Expert Investor or an Institutional Investor, Oanda Asia Pacific Pte Ltd (“OAP“) accepts legal responsibility for the contents of the report to such persons only to the extent required by law. Singapore customers should contact OAP at 6579 8289 for matters arising from, or in connection with, the information/research distributed.


ASXAUD-BEARISH HARMONIC REVERSAL PATTRENASXAUD is forming BEARISH HARMONIC REVERSAL pattren so i will long till point dand short from there.

ASX to find sellers at current swing highs?ASX200 - 24h expiry
Although the bulls are in control, the stalling positive momentum indicates a turnaround is possible.
This is negative for short term sentiment and we look to set shorts at good risk/reward levels for a further correction lower.
Although the anticipated move lower is corrective, it does offer ample risk/reward today.
The hourly chart technicals suggests further upside before the downtrend returns.
Further downside is expected although we prefer to sell into rallies close to the 7280 level.
We look to Sell at 7275 (stop at 7315)
Our profit targets will be 7175 and 7150
Resistance: 7305 / 7435 / 7600
Support: 7215 / 7120 / 7010
Risk Disclaimer
The trade ideas beyond this page are for informational purposes only and do not constitute investment advice or a solicitation to trade. This information is provided by Signal Centre, a third-party unaffiliated with OANDA, and is intended for general circulation only. OANDA does not guarantee the accuracy of this information and assumes no responsibilities for the information provided by the third party. The information does not take into account the specific investment objectives, financial situation, or particular needs of any particular person. You should take into account your specific investment objectives, financial situation, and particular needs before making a commitment to trade, including seeking advice from an independent financial adviser regarding the suitability of the investment, under a separate engagement, as you deem fit.
You accept that you assume all risks in independently viewing the contents and selecting a chosen strategy.
Where the research is distributed in Singapore to a person who is not an Accredited Investor, Expert Investor or an Institutional Investor, Oanda Asia Pacific Pte Ltd (“OAP“) accepts legal responsibility for the contents of the report to such persons only to the extent required by law. Singapore customers should contact OAP at 6579 8289 for matters arising from, or in connection with, the information/research distributed.

Aust 200 ?
Daily = flag
Bullish side.
It had broken last week. Now retraced
Low of flag = fail of pattern.
All the best

Plan shortPlan short
Post US CPI to close this weekend (at US closes)
Be wary of unexpected debt ceiling news
So open/close at every 15 mins s/r levels

ASX 200 bulls eye another crack at 7300 (Australia 200 CFD)The possible 'sympathy bounce' towards 7300 highlighted last week played out nicely. Whilst we're on guard for bearish momentum to return as part of the seasonal 'sell in May and go away', we retain a bullish bias over the near-term.
Prices have since pulled back from those highs and price action on the intraday chart appears to be corrective, in the form of a falling wedge (a bullish continuation pattern). It's forming a base around the 38.2% Fibonacci level and above the 50% retracement line, whilst RSI (14) is forming a bullish divergence.
- From here, bulls could consider bullish setups above 7226 in anticipation of a move higher
- The bias remains bullish above 7220
- The wedge pattern suggests an upside target near the base of 7300

Sympathy bounce for the ASX 200?Whilst prices are expected to open lower, we’re on guard for a small countertrend bounce. A bullish hammer formed on the daily chart at the lower Bollinger band which found support at the 50% retracement level and 200-day EMA. A bullish divergence has formed on the RSI (2) within the overbought zone. A break above yesterday’s high could potentially see it retest the 7275 low, or the monthly pivot point around 7300.
If we managed to bounce that far, we'd then look for signs of weakness for a potential swing trade short, given weak sentiment for global stocks and the tendency for stocks to underperform around this year due to "sell in May and go away" seasonality.
A break of yesterday’s low assumes bearish continuation.

ASX200 Looking fit for a shortPrice moving to balance a FVG and thiis FVG is located around the price region of an NWOG

XJO / AUCCI XJO / AUCCI
Every time the Australian consumer confidence index has fallen below 80 into severe pessimism the XJO has corrected at least 30% from peak to trough.
