AUS200 - Bullish StrategyAccording to chart analysis, We can see a bullish trend and a double bottom but there is a resistance that needs to be broken, and make sure to ride the trend because there is a bearish divergence on RSI.
Plan A: Long
Entry: 7613.3 (Current)
SL: 7524.6
TP: 7755.6
Plan B: Long
Entry: 7663.4
SL: 7561.4
TP: 7904.3
AUS200 trade ideas

AUS200 up or downAUS200 is kind of interesting to watch. We reached 7606 resistance, if we break it, we go to 7648. We def have enough momentum to go higher, inflations is a big problem, recession is about to start but it can take few months. We’re also in April- one of the most bulish month.
I don’t recommend to follow it but behind saying ‘sell in May and go away’ is a lot of truth. I think, and it’s only my opinion, it’s something that is happening right now.
I’m getting ready to open sell position next week- I expect market to try break the resistance at least once.
Please trade carefully.

AU200 will follow SPY, shortShorting AU200 until it stabilizes on past resistance.
I believe this will be quick, given how fast has SPX sunk.

AUS200price clear off the liquidity, and make a rejection on the lower time frame from the quasidomo level , i expect price to drop to the LOWE LOW of the structure which serve as the target

XJO If today's close ends up below the last candle, we have a situation where this index will turn bearish for a while. We hit R2 pivot level from last month, which is also near Quarterly Pivot

ASX BUY ::::: 8000.000000000000000000000000May you profit We profit and everyone profits.
All the best
Don't gamble.
Small happiness leads to better living
Follow leader :: Dow

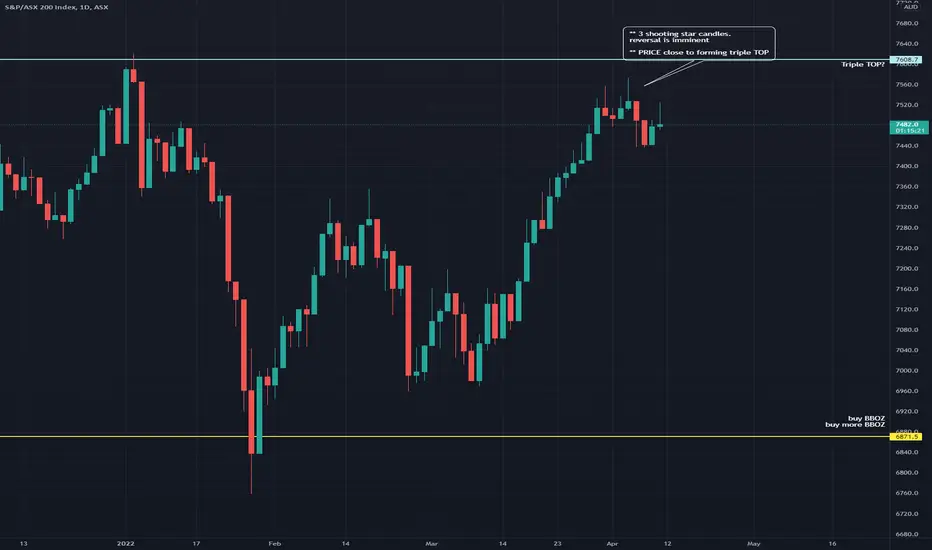
XJO reversal in plpaceDaily chart shows the information.
candles sticks showing reversal
PRICE level is close to forming triple top.
AUD 10 Y yeild is hitting 3% and close to breaking out
the shares will move higher if rates stay low
(RBA will need to intervene and buy up bonds)
what will the central planners decidie?
CRASH it or INFLATE it away????
Bad Quarter Ahead!!Crystal ball says AUX index looking at a red quarter ahead kkk. Well more like technical analysis really. Exhaustion candle on the weekly right on that trend line. I expect this coming week to be a red one. In fact I am looking for a red month even and target 6800 zone.
Entry : 7480 (Sell stop again)
SL : 7661 (slightly above that horizontal psychological level of 7650)
TP : 7000
TP2 : 6800
R : 3.7

XJO Closing up above swing high trend positivesharing my view on XJO ,
previous close above , i have been sharing my view earlier
this week due to holidays sharing my brief view the trend is positive and moved above our previous swing high on weekly basis.

ASX has extended and looking to test into resistanceLike a lot of major Indexes in Europe and the US, the ASX has extended higher into the end of the month and quarter. Expecting that there has been a lot of window dressing pumping the share markets higher so watching now for an opportunity to fade the strength for a move down.
The setup will be key as shorts have been squeezed out numerous times and I will have to be nimble if the setup plays out and then looks to fail for another short squeeze.
At this stage I am only on the hunt for the entry setup!!

AUS200 possible harmonic reversalSo far ASX has been a good bullish indicator, providing the confidence to hold long positions in stock. However spotted this possible harmonic reversal to consider. Trade your own plan do your own due diligence.

Breakout in Australia 200 Index, Target at 8000Trend Analysis
The main view of this trade idea is on the Daily Chart.
After declining approximately 12% over the last two week, the Australia 200 index began a symmetrical triangle setup pattern. The resistance trend line was calculated with the lower highs of 7660 and 7345 while the support trend line was calculated with the higher lows of 6750 and 6915. It appears that the Index has broken out of this setup and it is expected that it will rally towards the 8000 price level. A negation of this view will be observed if the Australia 200 Index falls below 7150.
Technical Indicators
The technical indicators support the view of a breakout in the Index. There has been a positive crossover on the 50-Simple Moving Average. The Supertrend is also in a buy zone after the Australia 200 Index closed above 7072 on March 9th. The Awesome Oscillator is above 0 and green while the RSI is off the oversold levels. Indeed the RSI was a bit range bound over the last couple of weeks and quite recently broke above that range, signaling a move higher for the Index.
The intra-day trend following indicators of the Australia 200 Index also display uptrends in the 15-Min, 2-Hour and 4-Hour Time frames.
Recommendation
The recommendation will be to go long at market, with a stop loss at 7150 and a target of 8000. This produces a risk/reward ratio of 2.87.
Disclaimer
The views expressed are mine and do not represent the views of my employers and business partners. Persons acting on these recommendations are doing so at their own risk. These recommendations are not a solicitation to buy or to sell but are for purely discussion purposes. At the time of publishing, I have exposure to the Australia 200 Index.

AU200AUD - BreakdownAU200AUD - Breakdown using the Charts Life trading strategy (style)
This is achieved using Pattern Separation, Charts patterns and Nature of the market.

AUS200 : FUNDAMENTAL ANALYSIS + LONG FORECAST | LONG SETUPAustralia stocks were higher after the close on Thursday, as gains in the IT, Consumer Discretionary and Financials sectors led shares higher.
At the close in Sydney, the S&P/ASX 200 rose 1.10%.
The best performers of the session on the S&P/ASX 200 were Flight Centre Ltd (ASX:FLT), which rose 6.61% or 1.17 points to trade at 18.87 at the close. Meanwhile, Webjet Ltd (ASX:WEB) added 5.83% or 0.31 points to end at 5.63 and Qantas Airways Ltd (ASX:QAN) was up 5.79% or 0.27 points to 4.93 in late trade.
The worst performers of the session were Nickel Mines Ltd (ASX:NIC), which fell 13.17% or 0.19 points to trade at 1.22 at the close. Rio Tinto Ltd (ASX:RIO) declined 7.73% or 9.27 points to end at 110.61 and Beach Energy Ltd (ASX:BPT) was down 5.90% or 0.10 points to 1.60.
Rising stocks outnumbered declining ones on the Sydney Stock Exchange by 857 to 547 and 380 ended unchanged.
The S&P/ASX 200 VIX, which measures the implied volatility of S&P/ASX 200 options, was up 1.91% to 17.12.
Gold Futures for April delivery was down 0.14% or 2.70 to $1,985.50 a troy ounce. Elsewhere in commodities trading, Crude oil for delivery in April rose 2.37% or 2.58 to hit $111.28 a barrel, while the May Brent oil contract rose 3.51% or 3.90 to trade at $115.04 a barrel.

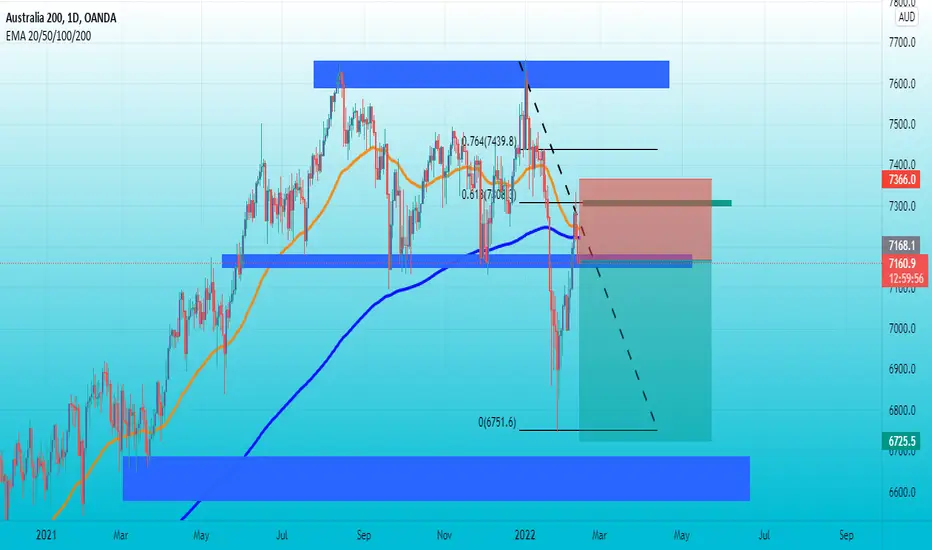
AUS200 long term possible forecastI suspect the market will go towards 8000 before will make a major correction to 61.8 fibonacci and drops to 5800.
I based that on previous market movements since 2008..
The move won’t occour as smooth as on the chart, we can have very choppy market for few months before we reach 8000.
Of course I might be wrong, don’t take it as a trading advice

AU200AUD SHORTHello traders, according to my graphical analysis of AU200AUD, there is a high probability of a decline towards support level showing on the chart .
thank you for watching the analysis, it will be great when you support it with a like, follow me for more market analysis.

AUS200 GOOD R:R LONGFundamental Insight:
No hike and dovish RBA as expected, they use geopolitical risk as excuse. AUS200 slump after the announcement, good long here as there's easing tension on Ukraine crisis, and bullish on US indeces too as now market betting for 25bps hike only.

AUS200 MELTDOWN pending AUS200 we can see a detailed description of what's going on.
- Head & Shoulders
- Bear flag break
- Neckline re - test
- Double top

AU200 Bearish Reversal Price Action, watch for sell
Hello traders
Most of the indices are looking pretty bearish across the board.
Here for the ASX, after the bearish impulse phase down, price had formed into an ascending channel reversal, and a "M" structure at the top.
These are good sign of bearish development, that could continue the bearish trend.
Last Friday we also see price commit to the downside more with impulse move,
now we can wait for continuation to confirm more downside to the next lows.
Higher time frame:
Thank you


au200A clear distribution situation is created in the AU200. This current model breaks the demand and creates an "LH" near the 0.618 axis. It clearly gives a hint that the price dump is about to happen. In addition, we can see that a death crossover is created during the daily time period