AUS200 trade ideas


XJO ASX200 will bounce off upper resistance and go lowerXJO ASX200 will bounce off upper resistance and go lower


Risk Management - ASX200What a close for Australia ASX200,
closed below 20 MA and 50 MA.
If we gap down and not close above 6586 early next week then support will turn to resistance.
This would indicate a pullback or correction is very likely...

Cycle of 5 x 60I believe we are going to see another flash crash here, price has progressed for 2 units of time (120days) declined for 1 unit of time (60days) and gone up another 2 units (120days) signalling a change in trend. :) Good luck :)

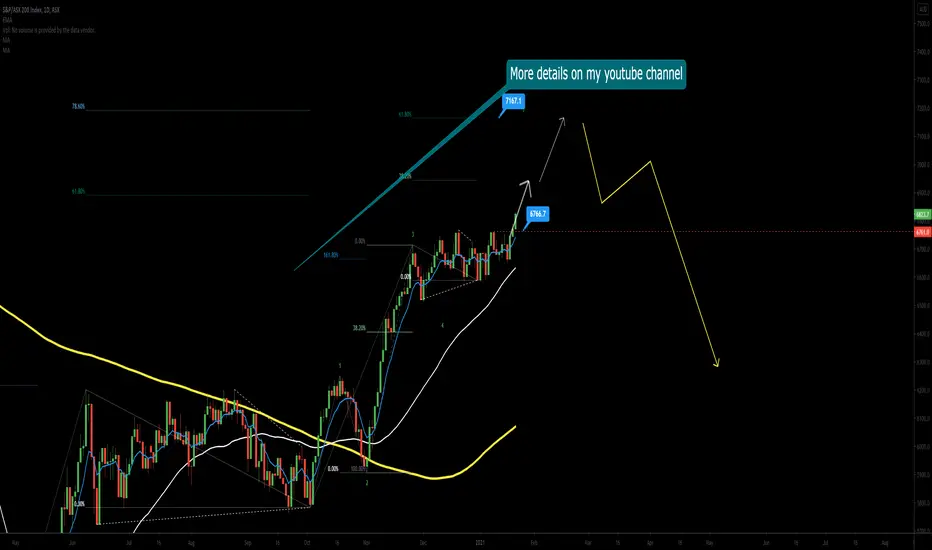
AUS 200 dump, and the sweet little bear flagWe've a good short opportunity here. I'm in at the top of flag.

What is happening here? What is giving us clues here?
Let's chat further about this in the network.
Cheers and trade safe
Dale

Where to from here for the ASX200Is the pullback today the start of something more sinister or just another flush lower to clear out some of the weak hands before having a run on new highs. We can see that the momentum is fading as we run up into previous highs but we have seen this action prior to making new all time highs that start of last year. For now, the 6585 area is key to hold to support the bulls. We will see in the follow few sessions whether the market is flushing lows prior to a run at highs or whether there is more downside to come.
-------------------------------------------------------------
WE TRADE WHAT WE TEACH
Check out our recent Live Streams from our profile page!!
-------------------------------------------------------------
** If you enjoy our free content, please support and follow our profile, by hitting the Follow button to get further high quality ideas. **
** If you are following our ideas any comments and likes are most welcome and will be greatly appreciated **
** With quality alerts and correct Risk Management, you can learn consistency and grow your account **
** With quality portfolio management and defined risk levels to help your account grow and achieve steady profit targets while increasing your trading edge. **

AUS200, sellHow to use TP!
When the order price breaks down Tp1,
you wait for Tp2 and SL moves to Tp1,
so as to secure earnings.
So with Tp2 to Tp3.
When we publish the closing of a position, you close it.
When the order comes to SL, always
consult with us, do not close the order.
Follow your open positions!

Bearish on XJOWhile noting a flatline on the candlesticks with a dropping momentum, we are inclined to believe that the Aussie fund will drop down. Currently we are looking at 65k, 64k, 63k projected levels. Fractally, it looks we are just due for a bit of a pullback anyway. Fractal analysis is not just a science, but a whole artform as well.


ASX - Wave Revision - Wave E In ProgressUnlike the Dow Jones it appears that the ASX has seen the end of Wave D.
We are dealing with an ending diagonal Wave E.
We have already seen Wave i and it appears Wave ii is almost complete.
Resistance is 6775 so this would be a good stop level.
I am shorting this from the highs until I see a completed Wave iii Zig-Zag to the downside.
Please LIKE and FOLLOW to get notification of updates and future posts.

Buy AUS200Buy AUS200. There is a trend reveal to the upside because it created a higher high and a higher low. Stop loss 6617.96, take profit 6708.52

AUS200 - ASX - Long Trade Idea - Wave 5See related idea below to understand what we are trading and why.
We are targeting all time highs.
Entry: 6681.73
Stop: 6623.45
Target: 7200.00
Please LIKE and FOLLOW to get notification of updates and future posts.

AU200AUD SHORT TRADE SETUP Possible Daily Head & ShouldersPossible head and shoulders on daily chart
All information given on chart. Please don't forget to like and follow for more setups.
Thank you and good luck
You can watch video as well for a better explanation

ASX - Australian Stock Exchange - The Final Wave Is In ProgressIt is the clear that this final move in the ASX is an Expanded Type-2 Zig-Zag Wave v.
I have linked the bigger picture below in related ideas.
White Wave 4 ended at 6,644 and is critical support for a long trade.
White Wave 5 will likely terminate at the highs marked in the green area.
White Wave 5 must make one final all-time-high in order to complete the move.
Please LIKE and FOLLOW to get notification of updates and future posts.

AU200AUD SHORT TRADE SETUP All information given on chart. Please don't forget to like and follow for more setups.
Thank you and good luck
Previous Video where I called out this setup

Au200AUD UPDATE the short brought in a few pip for profits. But this long Position is way more worth it. Hope everyone seen the switch up. Happy Trading day!

The Aussies: Mind the Wedges!I show what happened after two wedge formations. Note carefully wedges do not rule the market. The create probabilities not predictions. Wedges do fail.
There is hardly ever a perfect wedge pattern. The most recent one doesn't look too great. Price can fall out of a wedge and rock back in as you will see. Therefore trendlines drawn have to be estimates.
From experience only, recovery from the base of wedges - when the happen tend to get closer to the notional apex of the wedge or exceed them. As I said, there is no rule - because these formations do not rule the markets.
Wedges often don't work. These descending wedges shown are in a bull market, hence the expectation is for price to recover. This market could be collapsing when looked at from a higher time frame. Therefore, I do not expect a good retracement up on the most recent wedge. But I'm always happy to be surprised. My strategy here, is to follow a 5 to 10 min trend up as far as it will go. That means, no targets.
I am aware of much that has been written about wedges out there by many a guru. I do my own thing with these formations. I also know that wedges go by different names. Call it what you want - the important issue is the general shape. I am not a wedge expert.
Disclaimers : This is not advice or encouragement to trade securities on live accounts. Chart positions shown are not suggestions. No predictions and no guarantees supplied or implied. Heavy losses can be expected if trading live accounts. Any previous advantageous performance shown in other scenarios, is not indicative of future performance. If you make decisions based on opinion expressed here or on my profile and you lose your money, kindly sue yourself.


